Hematopathology Case Study: A 77 Year Old Man with Rash

Case History

The patient is a 77 year old man with a longstanding history of increased white blood cell (WBC) count who presented with a new rash and increasing absolute lymphocytosis.
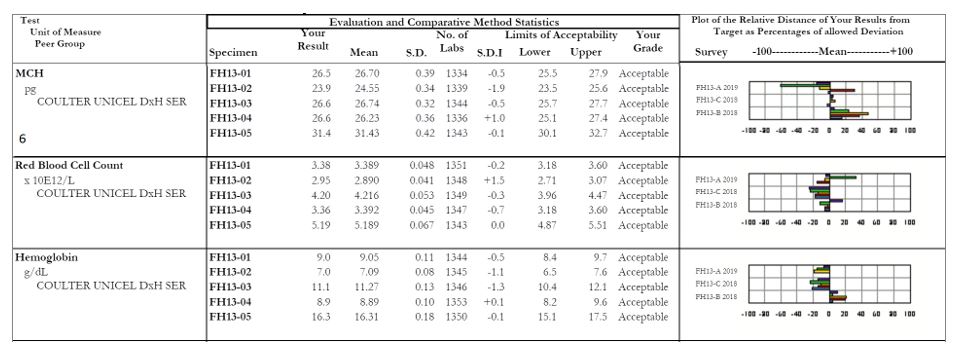
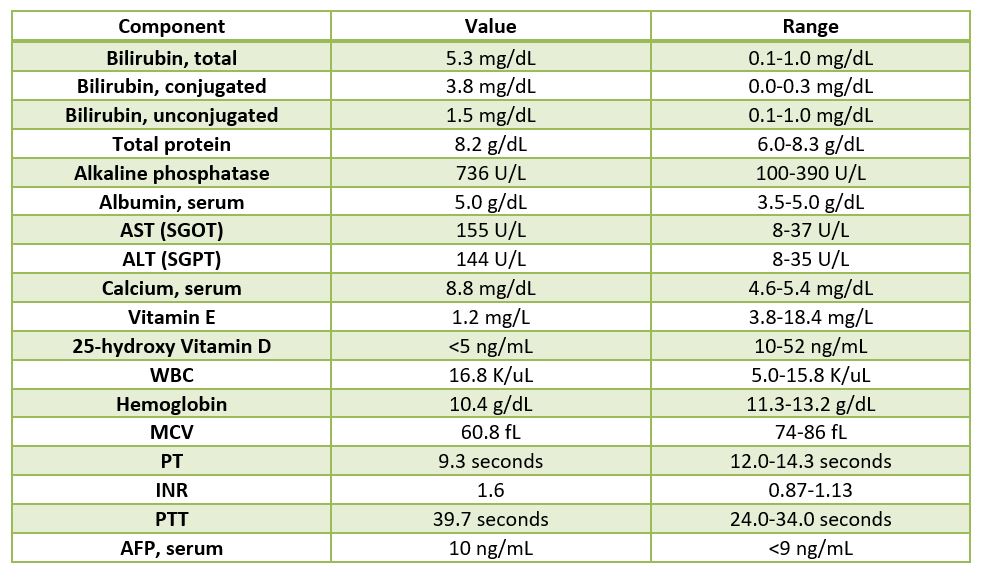
Labs

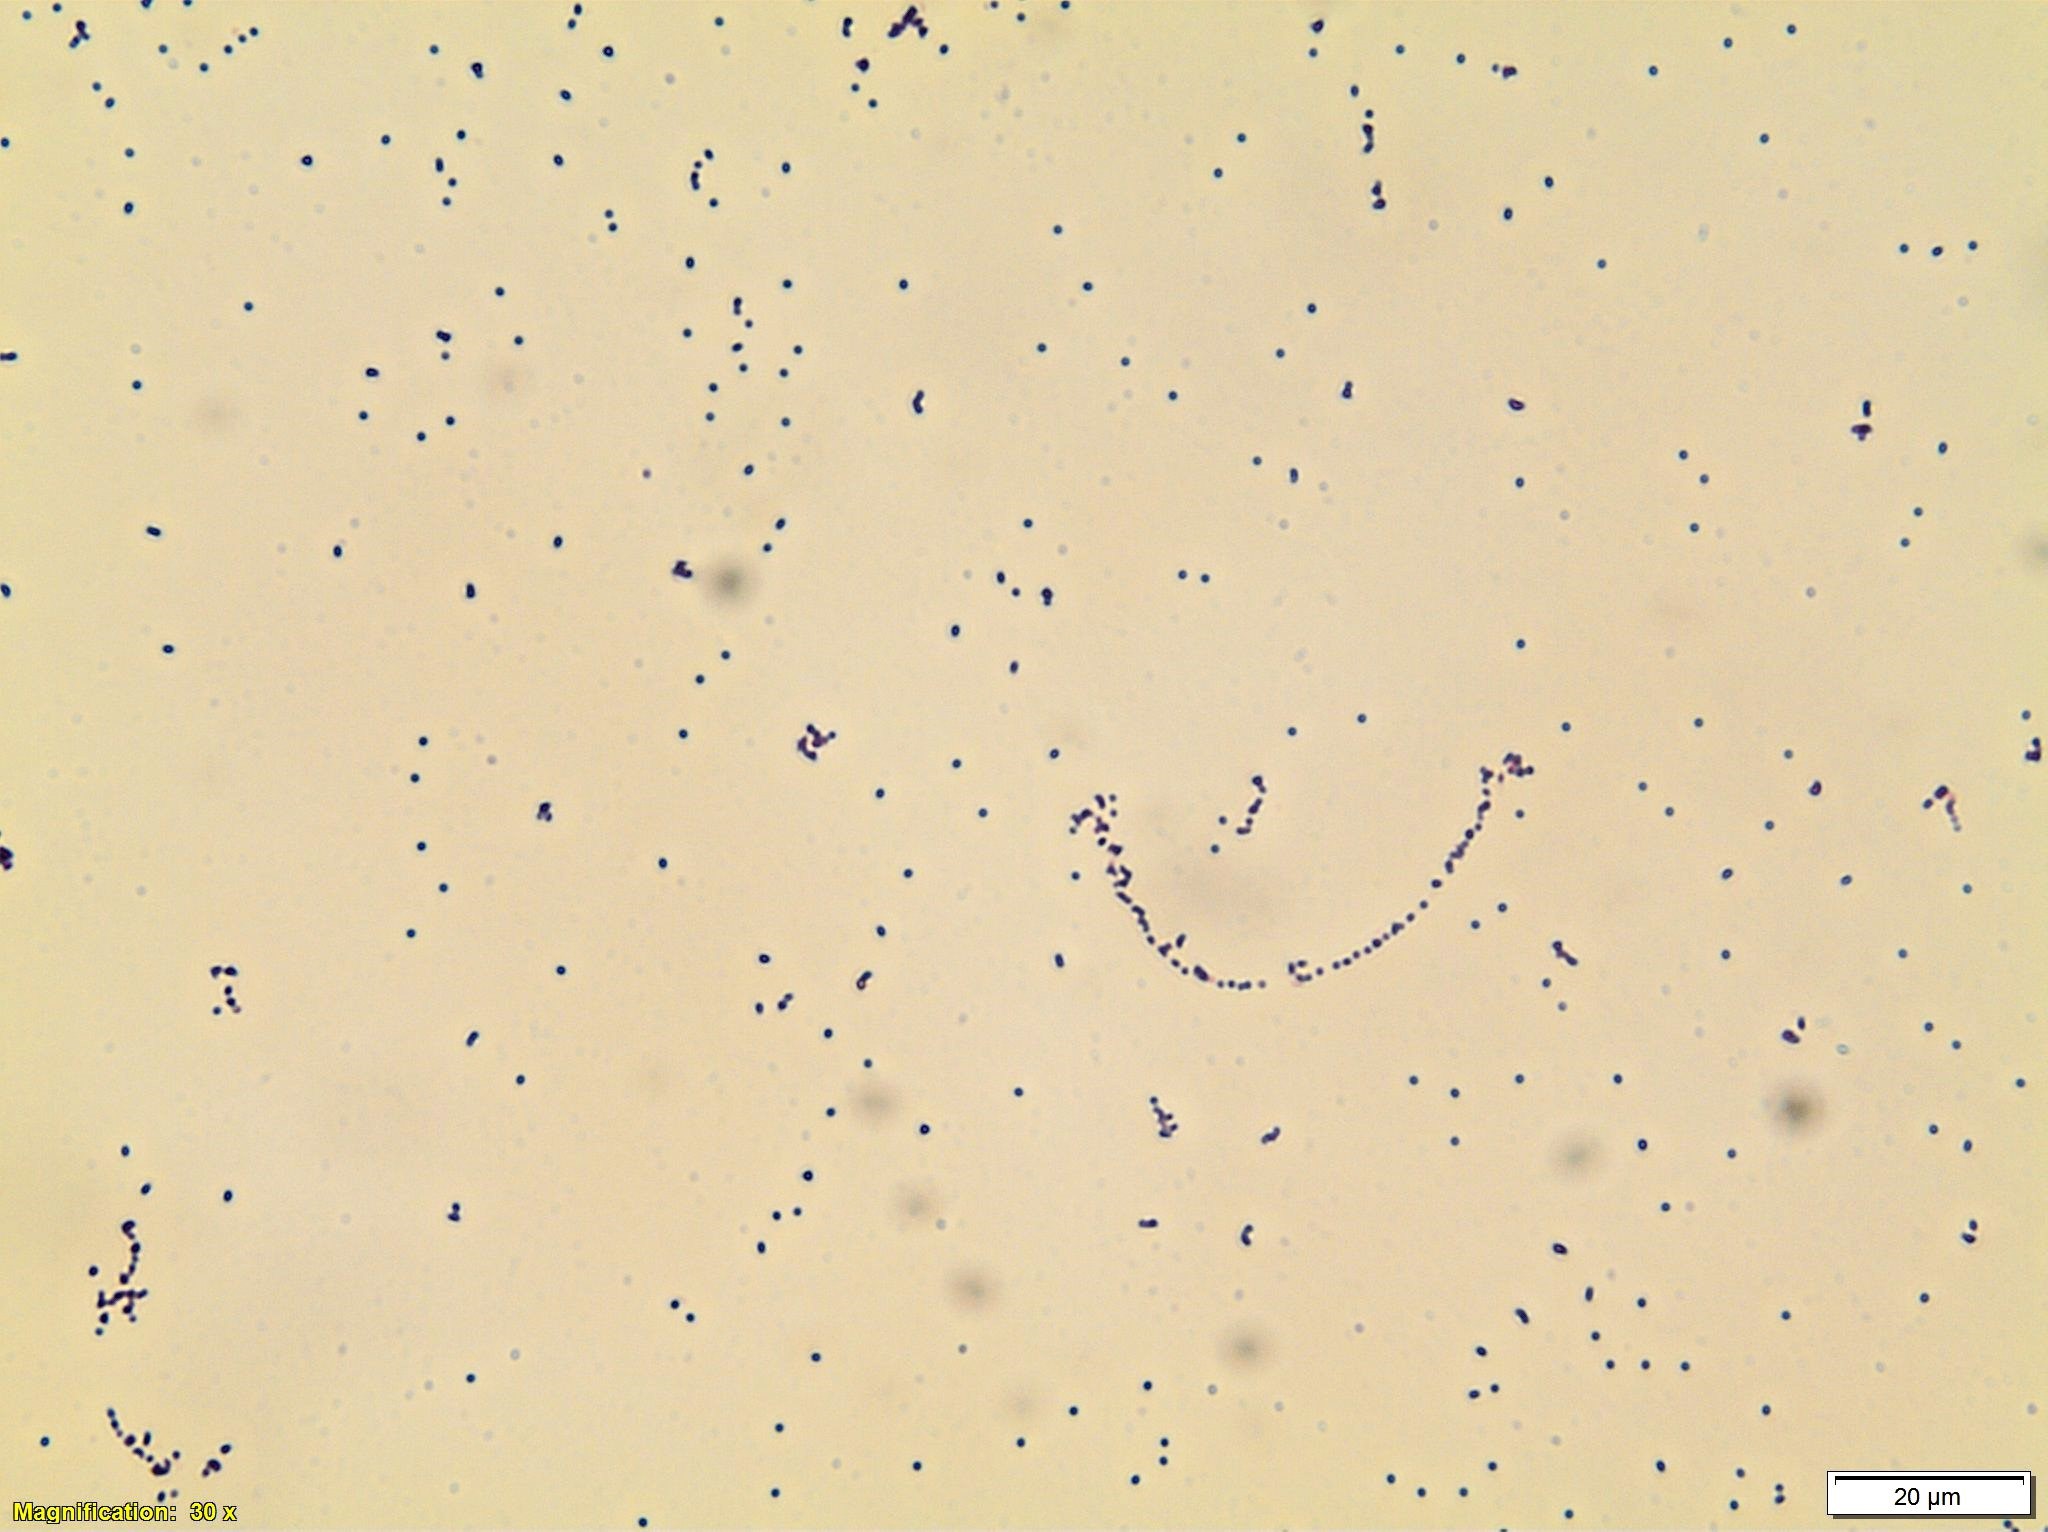
Peripheral Blood Smear

Peripheral blood smear shows small to medium-sized lymphocytes with basophilic cytoplasm, cytoplasmic protrusions or blebs, round to oval nuclei with indented nuclear contours and some cells with prominent nucleoli.
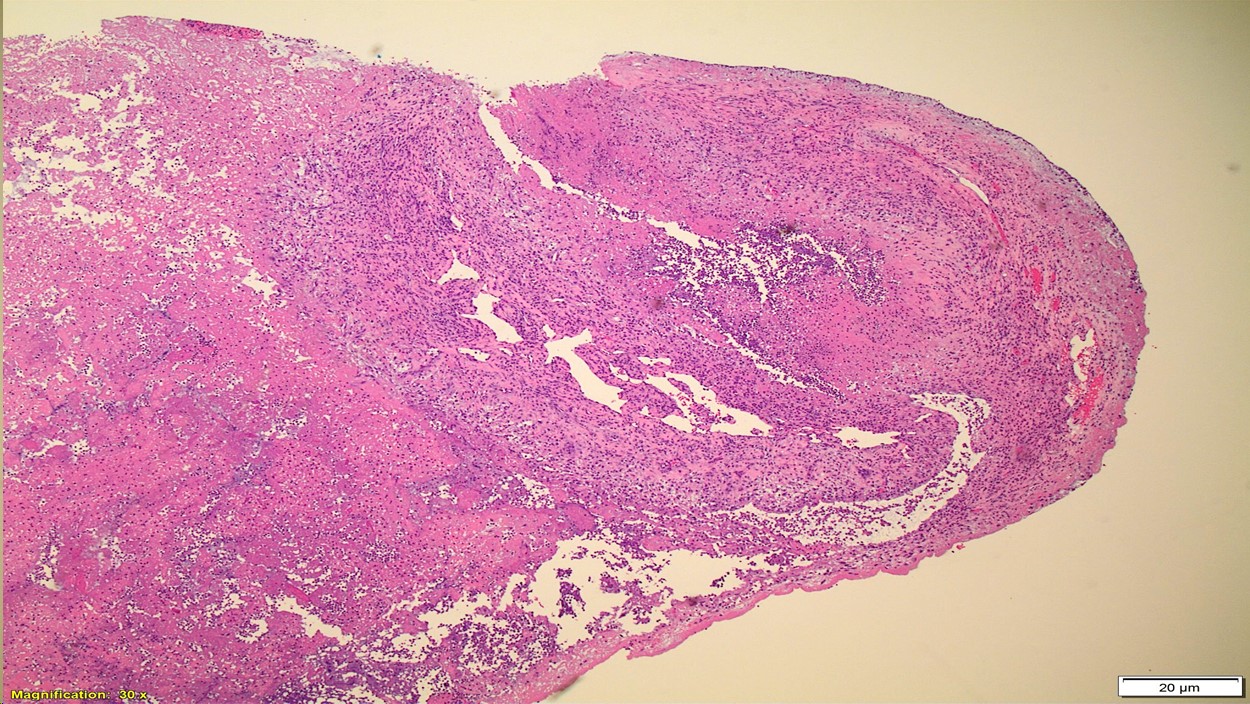
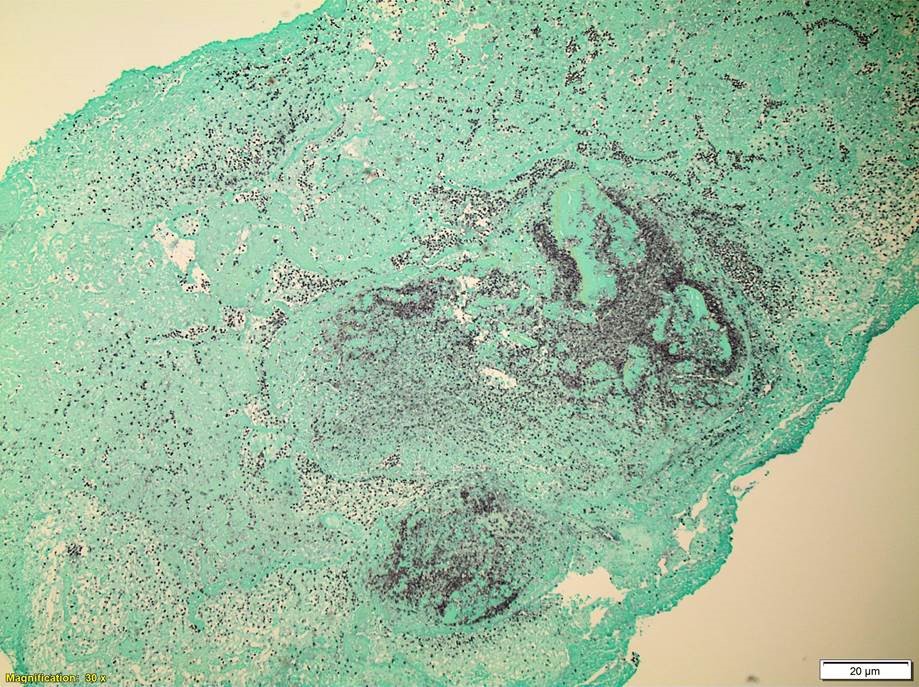
Bone Marrow Biopsy

Bone marrow aspirate (top left) shows increased lymphocytes with similar features to those seen in the peripheral blood. The core biopsy (top right) shows an abnormal lymphocytic infiltrate. By immunohistochemistry, CD3 highlights markedly increased interstitial T-lymphocytes (30-40%) that predominantly express CD4. CD8 highlights only few scattered T-cells.

Flow Cytometry

Concurrent flow cytometry identifies an expanded population of lymphocytes comprising 73% of the total cellularity. Of the lymphocytes, 98% are T-cells. The T-cell population is almost entirely composed of CD4 positive cells (CD4/8 ratio = 301). The T-cells show expression of TCR (a/b), normal T-cell antigens CD3, CD2, CD5 and CD7 and express CD52 (bright).

Cytogenetics

Concurrent chromosome analysis shows that 90% of the metaphase bone marrow cells examined have a complex abnormal karyotype with a paracentric inversion of chromosome 14 that results in the TRA/D/TCL1 gene rearrangement. There is also a rearrangement resulting in three copies of 8q with partial loss of 8p as well as other chromosome aberrations.

Diagnosis

Altogether, the presence of an abnormal CD4 positive and CD52 (bright) lymphocyte population with the characteristic cytogenetic finding of inv(14), is diagnostic of T-cell prolymphocytic leukemia (T-PLL). This patient’s course is unusual in that he initially presented with indolent disease that ultimately progressed. The lymphocyte morphology was also somewhat atypical in that only occasional cells had prominent nucleoli. This is consistent with the “small cell variant” of T-PLL.

Discussion

T-PLL is generally an aggressive disorder characterized by small to medium sized mature T-cells that are found in the peripheral blood, bone marrow, lymph nodes, spleen, liver and sometimes skin. T-PLL is rare and occurs in adults usually over 30 years old. The clinical presentation includes a lymphocytosis, often >100 x 10^9/L, hepatosplenomegaly and lymphadenopathy. Serous effusions and skin infiltration can be seen in a subset of cases. On microscopy, the cells are usually small to medium in size with basophilic cytoplasm, round to irregular nuclei and visible nucleoli. Characteristic cytoplasmic blebs or protrusions are a common feature. The immunophenotype is of a mature T-cell and cells are positive for CD2, CD3, CD5 and CD7. They are negative for TdT and CD1a. Another characteristic feature is bright expression of CD52. Sixty percent of cases are positive for CD4, while 25% show double expression of CD4 and CD8. The most frequent chromosome abnormality is inversion of chromosome 14 at q11 and q32, which is seen in 80% of patients. Translocations involving chromosome X and 14 are also seen, as well as abnormalities of chromosome 8. The overall prognosis is generally poor with a median survival of 1-2 years. Patients with expression of CD52 may respond well to the monoclonal anti-CD52 antibody alemtuzumab, but other treatment options are limited.1

The small cell variant (SV) of T-cell prolymphocytic leukemia was once referred to as T-cell chronic lymphocytic leukemia due to a predominant population of small lymphocytes with condensed chromatin and lack of conspicuous nucleoli. In addition, unlike the aggressive course seen in most patients with T-PLL, patients with this morphology tended to have an indolent or more chronic disease course. Eventually, it became clear that this was merely a variant of T-PLL due to similar immunophenotypic and cytogenetic findings. Ultimately, the term T-cell CLL was retired from use.2

In a comparison of patients with SV T-PLL to three large studies of classic T-PLL patients, the SV patients were found to have a higher frequency of a normal karyotype and increased double negative (CD4-/CD8) immunophenotype. Interestingly, 38% of the SV patients did not receive treatment for the entire duration of follow-up, while 19% required treatment after initially just being observed. This time period ranged between 2 months to 3 years. The remaining patients were treated at diagnosis. Most of the patients ultimately progressed and the cause of death was disease progression in 86% of the patients who died during follow-up. Overall, SV T-PLL tended to show less aggressive clinical behavior than classic T-PLL, however many aggressive cases of patients with the small cell variant have been seen. Likewise, more indolent cases of classic T-PLL featuring cells with larger nuclei with prominent nucleoli have also been described.2

While cases of SV T-PLL may initially present with more indolent disease, they almost always progress to a similarly aggressive disease course as seen in classic T-PLL. T-PLL is generally resistant to most conventional chemotherapies. As mentioned earlier, cases of T-PLL tend to express bright CD52, which is a glycoprotein present on the surface of mature lymphocytes. CAMPATH-1H is an anti-CD52 monoclonal antibody that may result in complement-mediated lysis and antibody-dependent cellular cytotoxicity. In a study by Dearden et. al., thirty-nine patients with T-PLL received CAMPATH-1H treatments. The overall response rate was 76% with 60% achieving complete remission. These rates are significantly higher than those reported for conventional therapies like CHOP. Unfortunately, almost all of the patients ultimately progressed and all but 2 had relapsed following 1 year of therapy. This indicates that CAMPATH-1H is good for first line therapy, but is not a curative treatment for this aggressive and most often deadly disease. 3

References

  1. Swerdlow SH, Campo E, Harris NL, et al. WHO Classification of Tumours of Haematopoetic and Lymphoid Tissues (Revised 4th edition). IARC: Lyon 2017.
  2. A. Rashidi and S. Fisher. T-cell chronic lymphocytic leukemia or small-cell variant of T-cell prolymphocytic leukemia: a historical perspective and search for consensus. European Journal of Haematology. 2015(Vol 95).
  3. C. Dearden, E. Matutes and B. Cazin, et. al. High remission rate in T-cell prolymphocytic leukemia with CAMPATH-1H. Blood. 2001(98)1721-1726.

Chelsea Marcus, MD is a Hematopathology Fellow at Beth Israel Deaconess Medical Center in Boston, MA. She has a particular interest in High-grade B-Cell lymphomas and the genetic alterations of these lymphomas.

New at the Multiplex: The Syphilis Shuffle

Hello again everyone and welcome back!

If you caught my previous post it was a rather long twofer for my March rotation at the Mayo Clinic’s Department of Pathology and Laboratory Medicine as well as a great case study of a patient’s therapy-related AML in the setting of Li-Fraumeni Syndrome. Now, as I inch closer and closer to my last months of medical school, I’m doing another pathology clerkship at Danbury Hospital in southwestern Connecticut. It’s an excellent community-based pathology program with a great staff. As you’ve read in my posts before, community hospitals are no stranger to the leading edge of laboratory innovation. A fellow medical scientist in a recent ASCP membership video on social media said, “Laboratory medicine is at the precipice of change.” As a beacon of translational medicine, labs turn routine medical unknowns into answers. Often, they act as leaders in the lab medicine community because of certain population-specific testing and reporting that goes on at their institutions. You might recall my discussion of Bronx-Care Hospital leading the charge in New York City with the newest, 5th generation troponin testing or my experiences at Swedish Covenant Hospital in Chicago with lab automation, software innovation, and CQI.

But back to medical school: the coordinators of this rotation asked be about my interests in pathology and we discussed my past as a medical laboratory scientist. As such, they offered some special projects for me to be a part of in their lab! Specifically, and in addition to my subspecialty objectives and observership, I’ve been helping them with three small projects. First, I assisted in calibrating a freshly validated second Bio-Rad Bioplex2200 analyzer to correlate to a second instrument for some very interesting testing. Second, I’m helping gather ongoing inter-instrument data for a Sebia serum protein electrophoresis instrument. And finally, I’ve been assisting the histopathology section with cross-instrument validation of immunohistochemical stains as well as gathering data for the validation of a great new IHC that would replace PSA.  All of these have both used skills from my MLS foundational experience but taken that one step further into the scope of a pathologist by going over the clinical implications and testing outcomes provided by these analyses.

The Syphilis Shuffle

I already mentioned that Danbury’s lab uses the Bioplex2200, so let me tell you a bit about the analyzer and a bit more about an interesting way to do syphilis testing. It’s an interesting immunoassay instrument that uses something called “multiplex” technology. I won’t go into the details about footprint, throughput, and timing because, well, I’m not exactly expecting any Bio-Rad checks over here. But what I do want to talk to you about is the testing methodology. So, what exactly is “multiplex” testing. Basically, by using magnetic beads with fluorescent dyes associated with various tests you can create bead-set assays. Those beads are coated with detection proteins for each assay and exist in a single reagent pack. That allows numerous analytes to be detected at the same time from a single aspirated specimen. A laser in the instrument detects these immunologic events and reports the values. Now, in my experience with immunoassays for tests like syphilis, hepatitis, EBV, or HIV, there are usually honorable mentions of Abbott’s ARCHITECT and Siemens ADVIA Centaur alongside the Bioplex2200. I’m much more familiar with the former two, so getting a chance to work with the latter was great. But what did I learn?

Figure 1. Immunoassay guests-of-honor from left-to-right: Siemens ADVIA Centaur, Abbott ARCHITECT, and Bio-Rad BioPlex2200. I guess clinical immuno is all about the swivel workstation screen placement. But all three instruments are excellent at what they do; an aspect of laboratory medicine is analyzing your analyzers. Depending on the needs of the institution, your lab might have different demands of what limits of detection, turn-around, and sensitivity/specificity statistics are required for populations of patients.
Figure 2. Final reaction mixture with coated, tagged beads passing through the detector simultaneously. (Source: Bio-Rad)

First of all, other analyzers like the ADVIA Centaur use chemiluminescent immunoassay technology and the Abbott ARCHITECH use photometric, potentiometric, or turbidimetric detection for immuno and chemistry tests. There are published demonstrations of how the three instruments compare regarding various metrics and detection statistics. One of those papers from 2017 demonstrated the sensitivity and specificity for HIV testing across the analyzers. Overall, it said the ARCHITECT was the best performing instrument (spoilers: this study was funded by Abbott), though each had their strengths—read the paper here. The multiplex method, although similar in principle, is unique to the BioPlex. And one of the tests I find interesting is their syphilis assay. On the BioPlex, its tested as a total immunoassay with RPR that improves accuracy and precision in real-time. It’s a dual treponemal/non-treponemal test. Those bead packs contain two types of beads that qualitatively detect IgG and IgM antibodies to Treponema pallidum while also qualitatively detecting RPR antibodies in serum or plasma. It comes with its own internal control and verification beads for internal QC. Fast, simple, easy, unique and just as accurate as most syphilis testing—that’s what I’m talking about.

Figure 3. Multiplex dual treponemal/non-treponemal immunoassay acts as a one-step test with less steps and less requirments for confirmatory testing. Just set it and forget it! Unless your test comes back positive, then call the local health department and get that penicillin injection, STAT! (Source: Bio-Rad)

(Immuno) Fixing Everyone’s Problems

I remember learning a lot about gel electrophoresis, serum/urine protein electrophoresis, and immunofixation in MLS school but never really spent too much time with gels. I didn’t get to do much work with electrophoresis because I spent my time in labs either on a microscope doing diffs, a blood bank shaking tubes, or monitoring chemistry outputs and validating reports. Despite spending years with an ID badge that often said “chemistry” on it, gels were a less common test and not just for me. The primary care clinician usually only orders SPEP and subsequent gels in the investigation of multiple myeloma or other paraproteinemia from a vast array of disease process. As such, the results are often more challenging to interpret and require reporting and education from the pathology department. There are, however, a myriad of interpretable patterns and information within the gels of an SPEP. The principle is standard—proteins separate in media based on charge and mass—and particular patterns tell us more information than one might realize. For example, chronic inflammatory processes might increase production of acute phase reactants like alpha-1-antitrypsin or haptoglobin. Where do the peptide building blocks for those new proteins come from? Wherever the most protein is: Albumin, obviously for those playing at home. So your friendly normal neighborhood SPEP in a chronic inflammatory process might morph into something with a fainter albumin band and some extra attenuation in the alphas 1 and 2. If you see that, you might correlate with an ESR or CRP (or hs-CRP, you fancy laboratorian) …

Figure 4. We’ve all seen one of these before, but there are so many patterns to interpret which translate to real pathology and correlate well with concomitant serum values implicated in anything from myeloma, to infection, inflammation, or hepato-renal disorders. (Source: Univ. of Washington)

NKX3.1, the Lexus of Prostate IHCs

Now for something different. Let’s talk about prostates. Fun! More specifically, let’s talk about prostate-related immunohistochemical stains. The first one you’ll think off right away is probably …drumroll… PSA, and you’d be absolutely correct. That’s a standard IHC for detecting prostatic adenocarcinoma and is especially useful in finding metastases from a prostate primary. Though not brand new, there is another stain for prostatic IHC detection that, in some recent studies, has been shown to be more sensitive for prostate malignancy than PSA by about 5%. It’s called NKX3.1 and it has PSA’s sensitivity of 94.2% beat at around 98.6%–that could translate to plenty of earlier diagnoses and better outcomes for patients.

Image 1. Immunohistochemical staining of prostatic tissue. In IHC stains, brown is positive for expression. The immunologic technique of marking a specific antigen with a detectable antibody can be translated to a long list of tissue typing and can identify nuclear, cytoplasmic, or membranous patterns. For something like prostate tissue (seen here) sometimes PSA and/or NKX3.1 can identify prostatic malignancy or distant, suspicious metastases. (Source: BioCare medical)

What’s that got to do with my current pathology rotation? Well, I’ve gotten a lot of anatomical pathology exposure in my time here and I even helped correlate IHC stain quality across two instruments. With that done, I’m currently collecting specimens of saved tissue blocks that were both positive and negative for the lab’s current prostate IHC, PSA, and retesting them all with NKX3.1 in order to switch protocols to the new, more sensitive test. At the very least, the addition of a secondary validated prostatic stain would be useful. What’s important in gathering specimens for this kind of correlation is understanding when and where this new stain would be positive and negative and making sure it behaves in your patient population the way you would expect. NKX3.1 is supposed to be positive in nearly 99% of prostatic adenocarcinomas whether they’re primary or metastatic. It is a Chromosome 8 protein which is expressed in the prostate and testis and can even be found in the salivary glands, bronchial submucosal glands, and regions of the ureters. It can be positive in 27% of invasive lobular carcinoma, 25% of metastatic lobular carcinoma, 2-9% of invasive ductal carcinoma, and 5% of metastatic ductal carcinoma. (Source: Pathology Outlines) While I’m looking over specimens with historical orders for PSA IHCs, not all are positive, and not all are prostatic tissue. Conducting validation studies like these in pathology really require a good understanding of how to clinically correlate data with useful decision-making and tailor it to your patient population.

I wrote about a lot of topics this month, I know, but I think there’s a common theme. As a medical laboratory scientist, like many of you, I’ve worked out countless QC problems and instrument validations per protocol. Now that I’m making the transition to medicine in pathology, there’s a lot of forethought and planning that goes into validating or calibrating any test. In chemistry you need to get your limits of detection just right and match your throughput with the test volume your population needs. In hematology, you better know exactly how cells get detected by your analyzers and have a solid algorithm for working up and understanding aberrant flags. When it comes to anatomic pathology, speaking a common language of morphology and pattern-recognition is vital to reporting reliable and critically important data. Laboratory medicine always exists at the forefront of medical testing and methodology, and what that translates to on a day-to-day basis is being able to know how to find, make, or confirm a good, reliable test. As for me, medical school is full of unique experiences and rewarding opportunities to learn. This month, I couldn’t be happier to use my skills in the lab to connect my time at the bench to my work learning, calibrating, and validating for the next step.

And, after all, aren’t we all looking for a little validation now and then?

Thanks to Danbury Hospital’s Department of Pathology and Laboratory Medicine for having me this month and thank you all for reading.

See you next time!

–Constantine E. Kanakis MSc, MLS (ASCP)CM graduated from Loyola University Chicago with a BS in Molecular Biology and Bioethics and then Rush University with an MS in Medical Laboratory Science. He is currently a medical student actively involved in public health and laboratory medicine, conducting clinicals at Bronx-Care Hospital Center in New York City.

Global Health Narratives Interview Series: Meet Dr. Drucilla Roberts

Drucilla Roberts, MD is a perinatal pathologist and a faculty member at Massachusetts General Hospital (Boston, Massachusetts). I found out about her work in global pathology when I spent time in a Ugandan laboratory she has been working in for about a decade. We didn’t meet there, but since then, I’ve read everything she has written about global pathology – she has published a wealth of knowledge on the topic. I recently spoke with her on the phone to find that she is incredibly kind, humble, and a true luminary. Read on to understand the needs of global pathology better and learn how you can get involved!

Q: Dr. Roberts, I’m curious to know how you got started in global health.

A: I have always wanted to give back to the continent–both my daughters and my husband are from Africa and I spent time in the early part of my career working in research under the Women and Infants Transmission Study (WITS) that studied the congenital transmission of HIV. I decided that I would find a way to volunteer my time as a pathologist while my family and I were in Ethiopia. I went to a teaching hospital and offered to volunteer my services–I made contacts and soon enough, I was giving lectures. And that’s how it all started! Since that humble beginning I have given three courses in sub Saharan Africa on the anatomic pathology of women and children. It is a privilege to teach in Africa and I hope to continue to do so.

Soon I was contacted by people working in perinatal global health that had heard I was working in Africa and recruited me to help with their projects in Botswana, Kenya, Tanzania, and Uganda. One main objective for me to become involved in research projects in Africa was to improve pathology capacity. For the last ten years, the majority of the work that I have done has revolved around capacity building.

Due to the nature of my work as a perinatal pathologist, many opportunities have arisen to work with populations internationally due to the abundance of research and volunteer roles that exist. I am often contacted to consult on perinatal and autopsy cases, and my subspecialty expertise has presented a perfect opportunity to provide mentorship.

Q: What are some improvements that you have seen in that time?

A: Generally, in medical academic institutions in East Africa, departments are split between the hospital and the university creating a competition for resources and energy between teaching and service work. Often service work suffers due to the discordant provision of resources. When I first started working there, I saw a very long turnaround time for cases due to issues beyond the lab’s control (e.g. supply chain problems and faculty disruptions). I’ve been fortunate to witness these institutions begin to prioritize patient care and create avenues to decreasing turnaround time. It’s been very rewarding for me to help support these efforts. Many exciting things have happened—an example from Mbarrara—when I first arrived, there was one broken microscope that the resident used, and one microscope that the chief pathologist used. There was no immunohistochemistry, and no cameras for photographing slides. Now, there is a multiheaded scope, multiple individual microscopes (that work!), and a microscope camera. There is power backup so equipment still runs when the power goes out (a common occurrence across the continent), an adequately equipped histology lab, and most recently a case tracking system! [More to come about this tracking system in a future interview with an amazing pathology PA–Nichole Baker.] The histology staff have received additional training and mentorship. The pathology residents have increased from one to four and have also received additional training, mentorship, and have access to subspecialist consult services from MGH when needed. The pathologists and residents can send MGH pathology case photos via email or blocks by courier and together we come up with a diagnosis. When on site immunohistochemistry was introduced, it was a huge advance! [Author’s note: I remember the effect this had when I was working in the lab in Mbararra–the clinicians used to ask the pathologist “Is it lymphoma?”, now after IHC they ask “Which type of lymphoma?”]

Q: What are some of the main problems to improving pathology services in Africa right now?

A: One of the biggest problems is that there are not enough pathologists. You can help improve things in individual labs to a point, but for long term there has to be more pathologists working in Africa. For example, the laboratory in Mbarrara went an entire year without a senior staff pathologist with a senior resident essentially running the department. Often the renumeration for the pathologists (residents and faculty) in government hospitals is so low that they take on second jobs in the private sector. One of the things that we in pathology need to focus on is building systems and influencing healthcare management policy across the continent. Recruitment of pathology residents, teaching, training, and continued medical education all need to be prioritized. [Authors note: Dr. Roberts has written extensively about the need for pathology services in Africa – for anyone interested in this topic, there are two key articles she authored that are a must read: “Pathology Functionality in Resource-Poor Settings” and “Improving Diagnostic Pathology Capacity for Global Cancer Care”. Another that she co-authored is crucial for understanding the seriousness and scope of the problem, “Improvement of pathology in sub-Saharan Africa”.]

Q: What can readers of this article do? Is there a way to volunteer and get involved?

A: Yes! Many pathologists volunteer, from fresh graduates to retired pathologists. Some come for just a few weeks, but some stay six months, or even a year. Volunteering to teach, train and do service work goes a long way to filling needs in these institutions. One major thing that pathologists can contribute in addition to service work is mentorship and teaching. It has an enormous impact on the trainees when they can benefit from an experienced pathologist, not only from signing out cases, but also having a role model and mentor. African pathologists often do not get the benefits that we take for granted -the value of attending conferences, continuing medical education, and interacting with our peers.

Research is another avenue in which it is possible to get involved – there are endless opportunities. For example, any tumor that you can imagine has probably not yet been fully characterized in Sub-Saharan Africa. In Mbarrara, the residents do a research project as part of their graduation requirement and many have paired up with volunteer Pathologist mentors. Some have published their work. Currently the MGH is sponsoring two projects with residents in Mbarara – MSI in colorectal tumors and TMPRSS2-ERG in prostate cancers. In addition to resident projects, I have several research projects in Ghana, Kenya, and Tanzania involving either placenta or autopsy studies. For example, we are looking at the effects of HIV infected mothers and placental health and how that relates to the child’s morbidity and mortality outcomes. My other projects are focused on studying the effects of poor air quality on placental health (many women use indoor stoves without proper ventilation) and similarly the placental effects of exposure to high concentration of pesticides (often lacking government regulation). To combat the infrequent performance of medical autopsies, and therefore lack of mortality data, I’m involved in a study that is exploring the use of minimally invasive autopsies and validating that data against a full autopsy. For all of these projects I engage and include local pathologists for training and mentoring in academic pathology.

The volunteers get a lot out of their service too – they see extremely interesting cases that are rarely seen in the US, and they have increased feelings of self-worth because they are really valued. It’s a very rewarding experience for all.

Another way to get involved is to advocate for global health partnerships in your home department, especially if you are in an academic center. Speak with the leadership to discuss getting involved globally, develop a budget, and advance opportunities for outreach. Make a global pathology contact and maintain continuity – offer support and help them advocate for pathology in their hospital, local government, and ministries of health.

Q: Your attention and focus could be used to serve in many areas; why focus on global health?

A: We are so fortunate in the USA that we can get a diagnosis that can guide treatment – when most of the world cannot! We should aim for equipoise, so there is a better chance for people to get the proper treatment with the right diagnosis. It really is not an unattainable task. It’s easy to get caught up in your own challenges here, but there are bigger challenges out there. If you go, you will see. You have to just go!


-Dana Razzano, MD is a Chief Resident in her third year in anatomic and clinical pathology at New York Medical College at Westchester Medical Center and will be starting her fellowship in Cytopathology at Yale University in 2020. She was a top 5 honoree in ASCP’s Forty Under 40 2018 and was named to The Pathologist’s Power List of 2018. Follow Dr. Razzano on twitter @Dr_DR_Cells.

Microbiology Case Study: a 49 Year Old Man with Chest Pain and Shortness of Breath

Case History

A 49 year old male presented to the emergency department (ED) with complaints of chest pain, shortness of breath, and chills for the past two weeks. He describes the pain as sharp and located on the left side of his chest. Past medical history is non-contributory, except for current IV drug use. His temperature was 97.7°F, blood pressure 141/63, heart rate 87, respirations 18 with an oxygen saturation of 91-93% on room air. On physical exam, a regular rate & rhythm with no murmur or regurgitation was noted and lungs showed fine bilateral crackles. His white blood cell count was increased at 22.1 TH/cm2 and troponin I was also elevated at 0.19 ng/ml. Blood cultures were collected and the patient was started on ceftaroline and piperacillin tazobactam for presumed infective endocarditis. He was transferred to the medical intensive care unit and intubated due to respiratory distress. An echocardiogram revealed a large mobile vegetation on the aortic valve with severe insufficiency and a vegetation & thickening of the mitral valve with severe regurgitation.

Laboratory Identification

Image 1. Gram stain showed gram positive cocci arranged in pairs and chains (1000x oil immersion).
Image 2. Small, gray, non-hemolytic colonies grew on blood and chocolate agar after 48 hours of incubation at 35°C in 5% CO2. There was no growth on MacConkey agar.
Image 3. Portions of valve leaflets showing acute neutrophilic fibrinous exudate (H&E, 300x).
Image 4. Special stain highlighting numerous bacterial cocci (GMS, 300x).

Blood cultures were positive within 24 hours of collection and gram positive cocci arranged in pairs and chains were noted (Image 1). Enterococcus spp., vancomycin resistance not detected was reported by polymerase chain reaction (PCR). Small, gray, non-hemolytic colonies grew after 2 days of incubation (Image 2). MALDI-TOF mass spectrometry identified the isolate as Enterococcus faecalis.

Discussion

Enterococcus spp. are gram positive, catalase negative cocci that are arranged in pairs & chains and are facultative anaerobes. Enterococcus spp. are widespread in nature and a component of the normal flora of the gastrointestinal tract and less commonly found in the oral cavity and on the skin. Commonly, Enterococcus spp. are opportunistic pathogens and cause infections of the urinary tract, intraabdominal cavity, surgical sites, bacteremia, and infective endocarditis.   

In the microbiology laboratory, Enterococcus spp. grow readily on non-selective media and are usually alpha-hemolytic or non-hemolytic on blood agar. The two main species, E. faecalis and E. faecium, will grow in 6.5% NaCl, hydrolyze esculin in the presence of bile salts, and are positive for both leucine aminopeptidase (LAP) and L-pyrrolidonyl-beta-naphthylamide (PYR). Biochemically, arabinose utilization serves as a useful indicator to distinguish E. faecalis (negative) and E. faecium (positive). A variety of identification systems are able to identify the great majority of Enterococcus spp. to a species level.

Ampicillin or vancomycin are acceptable treatment options for Enterococcal infections if found to be susceptible by antibiotic testing. It is important to note, Enterococcus spp. are intrinsically resistant to cephalosporins, aminoglycosides, trimethoprim-sulfamethoxazole, and clindamycin. For serious infections, including infective endocarditis, it is recommended to treat with a cell wall active agent such as ampicillin and an aminoglycoside (gentamicin or streptomycin) to create a synergistic bactericidal effect. Emergence of E. faecium acquired vancomycin resistance (VanA/VanB) is increasing and more board spectrum agents such as daptomycin and linezolid are necessary to effectively treat these infections.     In the case of our patient, upon identification of E. faecalis from multiple blood cultures, his antibiotics were switched to IV ampicillin and gentamicin. He underwent valve replacement surgery and both the aortic and mitral valves grew E.faecalis as well and showed numerous bacterial cocci on histology (Images 3 & 4). He completed a six week course of ampicillin and gentamicin and was discharged home in good condition.

-Hansini Laharwani, MD is a first year Anatomic and Clinical Pathology resident at the University of Mississippi Medical Center. 

-Lisa Stempak, MD, is an Assistant Professor of Pathology at the University of Mississippi Medical Center in Jackson, MS. She is certified by the American Board of Pathology in Anatomic and Clinical Pathology as well as Medical Microbiology. She is the Director of Clinical Pathology as well as the Microbiology and Serology Laboratories. Her interests include infectious disease histology, process and quality improvement, and resident education.

Blood Bank Case Study: Hemolytic Disease of the Fetus and Newborn due to anti-K

A 28 year old woman, gravida 1 para 0 presented to her OB/GYN for her first prenatal visit. A type and screen was ordered and the patient typed as A pos, with a positive antibody screen. Maternal history indicated that she had received several transfusions, for a total of 5 units of blood, following an automobile accident 15 months previously. An antibody identification was performed and Anti-K was identified in her plasma. The patient sample was phenotyped and was confirmed to be K negative.

Is the fetus at risk for Hemolytic Disease of the Fetus and Newborn (HDFN)? How can we know? And, if so, how should this pregnancy be monitored?

The answer to these questions is not a simple answer, and depends on several factors. Let’s look first at HDFN and its causes. HDFN is destruction of the RBC’s of the fetus and newborn by antibodies produced by the mother. This happens in 2 steps. The first step is that  blood containing a foreign antigen enters the maternal blood stream and stimulates the mother to produce unexpected IgG antibody. But, how is a mother exposed to these foreign antigens? The mother is exposed either via a blood transfusion or a previous pregnancy. In this case, this was the mother’s first pregnancy, however her history revealed that she had been previously transfused. In order for the mother to produce anti-K , she must be K antigen negative, which was confirmed in the Blood Bank testing. She was exposed to the K antigen through transfusion and produced the anti-K antibody to the foreign antigen. The second step in the development of HDFN occurs when the mother’s antibody crosses the placenta and binds to this foreign antigen present on the red blood cells of the fetus. This can lead to RBC suppression, destruction, and fetal anemia.

Again, certain criteria must be met. First of all, the antibody must be IgG. Only IgG antibodies can cross the placenta. Active transport of IgG from mother to fetus begins in the second trimester and continues until birth. Secondly, the mother’s antibody is only of concern if the baby possesses the antigen that the mother lacks. Where does the baby get an antigen that is foreign to the Mom?? It’s the Dad’s Fault!! In HDFN, the mother lacks the antigen in question and the fetus possesses the antigen, which is of paternal origin.

How do we determine if the fetus has the K antigen and is at risk? If you remember your genetics and Punnett squares, if the mother does not have the antigen and the baby does, the father must possess the antigen, because the baby gets an allele from each parent. This means that the fetus affected by HDFN is always heterozygous for the antigen in question. Figures 1, 2 and 3 below illustrate the possible inheritance patterns. In the first scenario, shown in Figure 1, the baby would not inherit a K antigen and would not be at risk for HDFN. In the Figure 2 scenario, the father is homozygous for K, and 100% of offspring from these parents would be K positive. Figure 3 illustrates a heterozygous father who would have a 50% chance of passing this gene to their offspring.

Figure 1. Punnett square showing inheritance of K antigen. Mother (on side) is negative for K (kk), father (at top) is also negative, homozygous kk
Figure 2. Punnett square showing inheritance of K antigen. Mother is negative for K (kk), father is homozygous KK
Figure 3. Punnett square showing inheritance of K antigen. Mother is negative for K, father is heterozygous Kk

The father was phenotyped as K positive. The father’s blood sample was sent out for further zygosity testing, and he was found to be heterozygous for the K antigen. Thus, the fetus had a 50% chance of being affected by HDFN, and further testing was performed. The mother’s antibody titer was 1:4. To avoid an invasive procedure such as amniocentesis or chorionic villus sampling (CVS) which may worsen maternal alloimmunization, fetal DNA was isolated from the mother’s plasma at 12 weeks’ gestation and the fetal genotype was determined. The fetus was determined to be K positive and at risk for HDFN.

The mother’s titer and the fetus continued to be monitored. Diagnostic ultrasounds were performed to monitor fetal size, age, and structural changes. At 16-18 weeks’ gestation, ultrasounds of the middle cerebral artery (MCA-PSV) were performed to assess fetal anemia. MCV-PCA of 1.29 -1.5 multiples of mean (MoM) for the gestational age is indicative of mild anemia. Higher values predict moderate to severe anemia which require further intervention. At 18 weeks the MCV-PCA was 1.27 MoM and the fetus was determined to be developing normally.

A type and screen and antibody titer at 28 weeks showed the mother’s titer had increased, to 1:32, indicating that fetal RBCs with K antigen had entered the mother’s circulation and were stimulating further antibody production. Repeat MCV-PCA was 1.33, indicating mild anemia. Weekly measurements of MCA-PCV were recommended. At 32 weeks, a sudden increase was recorded, with MCV-PCA of 1.65 MoM. Cordocentesis was performed and fetal hemoglobin was 6.2g/dl. Fetal DAT was positive and anti K was identified in the eluate. An intrauterine transfusion (IUT) was performed. IUT was repeated at 34 and 36 weeks. The infant was delivered at 37weeks. The newborn required several neonatal transfusions while in the hospital and was discharged to home 3 weeks later.

Kell isoimmunization is the third most common cause of HDN after Rh and ABO and the most clinically significant of the non-Rh system antibodies in the ability to cause HDFN.  It tends to occur in mothers who have had several blood transfusions in the past, but it may also occur in mothers who have been sensitized to the K antigen during previous pregnancies. Anti-K HDFN may cause rapidly developing severe fetal anemia. Anemia and hypoproteinemia are dangerous to the unborn child because they can lead to cardiac failure and edema, a condition known as hydrops fetalis. The MCA-PSV is a non-invasive doppler measurement of peak systolic velocity which is used to monitor fetal anemia. As mentioned previously, MCV-PCA of 1.29 -1.5 multiples of mean (MoM) is indicative of mild anemia. Values greater than 1.5 MoM are very sensitive and can be used to predict moderate to severe anemia that would need intervention.

HDFN due to anti-K differs from ABO and Rh HDFN in that, in HDFN due to K alloimmunization, Anti-K targets the RBC precursors. Remember that the K antigen can be detected on fetal RBCs as early as 10 weeks. The  primary mechanism of K HDFN is due to maternal anti-K antibody actually suppressing the fetal production of RBCs, rather than hemolysis of mature fetal RBCS as seen in ABO and Rh HDFN. With reduced hemolysis, amniotic fluid bilirubin levels also do not correlate well with the degree of anemia. In addition, alloimmunization due to Anti-K differs in that even a relatively low maternal anti-K titer can cause erythropoietic suppression and severe anemia. In Rh HDFN, a critical titer is considered to be 16. In anti-K HDFN, a critical titer is considered to be 8, and newer research  suggests a titer of 4 should be used to target clinical monitoring.4 Since fetal anemia can occur even with low titers, and the titer does not necessarily correlate to the degree of anemia, fetal MCA-PSV measured by Doppler ultrasound is the investigation of choice in the evaluation of anemia related to maternal K alloimmunization.

-Becky Socha, MS, MLS(ASCP)CM BB CM graduated from Merrimack College in N. Andover, Massachusetts with a BS in Medical Technology and completed her MS in Clinical Laboratory Sciences at the University of Massachusetts, Lowell. She has worked as a Medical Technologist for over 30 years. She’s worked in all areas of the clinical laboratory, but has a special interest in Hematology and Blood Banking. When she’s not busy being a mad scientist, she can be found outside riding her bicycle.

Proficiency Testing (PT) Part 3: Quality Indicators

Last month we discussed the rules associated with evaluating your PT results, and how to investigate any unsuccessful surveys. In the last of this 3-part series we’ll review ways to utilize your PT reports to check for trending in your patient values – shifts, trends and bias. Your PT results can help show you developing problems and allow you to correct them, before they become failures or begin to affect patient care. Before declaring a failure as a ‘random error’, be sure that it truly is.

Accuracy & Systematic Errors

Accuracy describes how close your measured value is to the reference value – did you obtain the correct result? This will be affected by systematic errors, such as using expired or degraded reagents, changes in lot numbers or calibration values, or instruments with analytical lamps or lasers near the end of their use life. Systematic errors are reproducible inaccuracies that occur in the same direction; all results will be falsely low or all results will be falsely high. If systematic errors are present, all results will show similar deviations from the true value. Bias is a measure of how far off your results are from their true intended value.

Precision and Random Errors

Precision on the other hand refers to the overall agreement of results upon replicate testing – will you get the same value if you repeat the test? Precision is affected by random errors, such as incomplete aspiration of a sample or reagent due to fibrin clots or air bubbles, operator variability in pipetting technique, or temperature fluctuations. Random errors are statistical fluctuations in the measured data due to the limitations of the assay in use. These errors will occur in either direction from the mean, unlike systematic errors that will be on the same side. Imprecision can be measured and monitored by evaluating the standard deviation (SD) and coefficient of variance (CV) for an assay.

https://blog.forecast.it/the-difference-between-accuracy-and-precision

Let’s look at some example PT results from CAP, and see what hints these reports reveal to us.

  • Albumin: Although all results passed and were graded as ‘acceptable’, there are still issues that should be looked into. For the last 3 surveys in a row, the plot shows that nearly all samples have been on the same right side of the mean. When comparing the value of the % relative distance from the first survey to the most recent one, you can see that the values are trending worse and getting closer to being unacceptable if the pattern continues. Additionally, be mindful of the standard deviation index (SDI) value reported. This is a measure of your bias, and how far off your values are from the mean. It should be defined within your Quality System Manual (QSM) the values which should trigger an investigation, but as a general rule, anything >±2.0 indicates a potential issue. (https://unityweb.qcnet.com/Documentation/Help/UnityWeb/399.htm)
  • Alkaline Phosphatase: Again all results passed, but 3/5 samples have SDI values >±2.0. The first survey had all values to the right of the mean, the second survey was a nice tight even mix of +/- bias, and now with the most recent survey all values are appearing to the left of the mean. If this shift coincides with a change in lot number, a calibration may be necessary to get results back on target to help lower the SDI values.
  • GGT: Although only 1 sample was graded as unacceptable, all of the results for this recent survey were at risk of being failures due to how close they were to the upper limit of acceptability. Results like this should be very carefully evaluated to ensure that there is no impact on patient care. Provided the sample stability has not been exceeded, all 5 samples should be repeated. If the repeat values are closer to the target mean, you will need to identify what went wrong on the day the samples were originally tested. If the repeat values are still grossly far from their intended target, a full patient lookback would need to be performed from the time the samples were originally tested until the day they were repeated, as there is a systemic problem that has now continued for weeks or longer.  
  • Vancomycin: Similar to the albumin example above, these results show a trend occurring between the first survey and the most recent; however unlike albumin these are moving in the correct direction. Values are getting closer to the target mean, and SDI values are decreasing, suggesting that any corrective actions implemented after the last survey were successful.
  • Lithium: This shows a good example of what you hope all of your quantitative proficiency results will look like. There is a nice distribution of results on both sides of the mean, and SDI values are all relatively low. Values such as these allow you to have complete confidence in the accuracy of your patient results.
  • MCH: Focus on sample #2, with an SDI of -1.9. The other samples within this survey all appear fine, but it looks as though there was truly a random error with sample #2. When we look at the affiliated analytes we see a similar issue with the RBC count of sample #2, which coincides with our decreased MCH (a reminder for our non-hematology readers, MCH = (Hgb x 10)/RBC). For any calculated values, be sure to evaluate the all parameters together as well as individually to serve as a common sense check that your results are appropriate and truly make sense.

It is important to have a robust quality assurance program that outlines what to monitor, key decision points for when to take action, and guidance on what those actions should include. Your proficiency testing results can provide you with a ton of useful information to evaluate the overall quality of laboratory, and help provide confidence in the patient values being reported out as well.

-Kyle Nevins, MS, MLS(ASCP)CM is one of ASCP’s 2018 Top 5 in the 40 Under Forty recognition program. She has worked in the medical laboratory profession for over 18 years. In her current position, she transitions between performing laboratory audits across the entire Northwell Health System on Long Island, NY, consulting for at-risk laboratories outside of Northwell Health, bringing laboratories up to regulatory standards, and acting as supervisor and mentor in labs with management gaps.

Microbiology Case Study: A 70 Year Old Male with a Decubitus Ulcer

Clinical History

A 70 year old male with a history of multiple system atrophy and left hip fracture presented to his primary care physician after being found by his home health nurse to have a sacral decubitus ulcer. Physical examination revealed an afebrile immobile patient with a 3.0 cm stage III ulcer over the sacrum with purulent exudate. Tissue was obtained and sent to our laboratory for Gram stain and culture.

Laboratory Findings

Gram stain was significant for many polymorphonuclear neutrophils and mixed gram positive and gram negative organisms. Blood and chocolate plates grew mixed organisms with a predominant gram positive coccobacillus. Matrix assisted laser desorption ionization-time of flight mass spectrometry (MALDI-TOF) identified this organism as Trueperella bernardiae.

Image 1. Gram stain from tissue showing mixed gram positive and gram negative organisms.
Image 2. Blood agar showing non-hemolytic white colonies.

Discussion

Trueperella bernardiae is a nonspore-forming, facultatively anaerobic, gram-positive coccobacillus. It was previously categorized within the Actinomyces and Arcanobacterium genera. It is classically associated with pig farming. It is often considered to be a contaminant or normal flora, however, it has been reported as a cause of bone and soft tissue infections. Highly invasive diseases are rare. The incidence of infection may have been underreported previously due to the difficulty to culture and identify it from normal flora prior to the advent of MALDI-TOF. Antibiotic sensitivity data is limited, however, there are reports of susceptibility to beta-lactams, clindamycin, tetracycline, and vancomycin. Minimum inhibitory concentration interpretation is often based on data from bacteria of the Corynebacterium.

References

  1. Rattes ALR, Araujo MR, Federico MP, et al. Trueperella bernardiae: first report of wound infection post laparoscopic surgery. Clin Case Rep. 2016 Aug;4(8):812-815.
  2. Lawrence CHD, Waseem S, Newsholme W, Klein JL. Trueperella bernardiae: an unusual cause of septic thrombophlebitis in an injection drug user. New Microbes New Infect. 2018 Nov;26:89-91.
  3. Cobo F, Rodriquez-Granger J, Sampedro A, et al. Two Rare Cases of Wound Infections Caused by Trueperella bernardiae. Jpn J Infect Dis. 2017;70:682-684.
  4. Gowe I, Parsons C, Best M, et al. Successful treatment of olecranon bursitis caused by Trueperella bernardiae: importance of environmental exposure and pathogen identification. Case Reports in Infectious Diseases. 2018;5353085.

-Jonathan Wilcock, MD is a 1st year anatomic and clinical pathology resident at the University of Vermont Medical Center.

-Christi Wojewoda, MD, is the Director of Clinical Microbiology at the University of Vermont Medical Center and an Associate Professor at the University of Vermont.

Surgical Pathology Case Study: A 2.5 Year Old Male Who Presents with Jaundice and Pruritus

Case History

The patient is a 2.5 year old male who is being evaluated for a liver transplant versus biliary diversion surgery. The patient was born at 2 kilograms and went home with mom one week after birth. The patient was readmitted back to the hospital for evaluation of jaundice and since then the patient has been intermittently hospitalized for episodes of worsening jaundice, acholic stools, scleral icterus, and pruritus. At 5 months of age, the patient was diagnosed with progressive familial intrahepatic cholestasis, type 2, and was placed on the liver transplant list. As a result of the liver failure, the patient has developed coagulopathy, hypocalcemia resulting in seizures, and pruritus. The family history is significant for no known congenital liver diseases.

Table 1. Pertinent lab findings.

The father was worked up for living donation and was found to be a suitable donor, and is donating the left lateral segment of his liver.

Diagnosis

Received in the Surgical Pathology laboratory is a 700 gm, 23.5 x 14.5 x 3.5 cm explanted liver with an attached 4.5 x 1.2 x 0.4 cm gallbladder. The liver specimen has a smooth, green-red liver capsule without any grossly identifiable nodules or lesions (Image 1). The gallbladder has a yellow-pink external surface and is opened to reveal a 1.5 x 0.7 x 0.4 cm dark brown stone with a small amount of brown-yellow bile fluid. The liver is sectioned to reveal a smooth green-red cut surface (Image 2). No lesions are identified and minimal hilar structures are included with the specimen. Portions of the specimen have been taken for electron microscopy and frozen for future diagnostic purposes. Submitted sections include:

Cassette 1 and 2:   Hilar structures

Cassettes 3-15:   Representative sections of liver parenchyma

Cassette 16:   representative section of gallbladder

Image 1. Posterior aspect of green-tinged liver
Image 2. Cut section of liver

On microscopy, the trichrome stain highlights the presence of portal and centrilobular fibrosis, with focal bridging. However, regenerative nodule formation is not evident. The portal tracts contain sparse mononuclear cell infiltrates. Significant bile ductular proliferation is also evident, as confirmed by a CK7 immunostain. However, the native bile ducts appear unremarkable. There is also considerable hepatocellular and canalicular cholestasis in the centrilobular regions. Occasional multinucleated hepatocytes are also seen within the centrolobular zones. No steatosis is evident.

This constellation of histologic features is consistent with the clinical history of progressive familial intrahepatic cholestasis, type II.

Discussion

Progressive familial intrahepatic cholestasis (PFIC) is a group of autosomal recessive disorders that affects bile formation and results in cholestasis of the liver, usually beginning in infancy and childhood. There are three types of PFIC, each related to a mutation in the liver transport system genes that are involved in bile formation. PFIC type 1 (PFIC1), which is also referred to as Byler disease, is due to impaired bile salt secretion related to a ATP8B1 gene that encodes the FIC1 protein. PFIC type 2 (PFIC2), which is referred to as Byler syndrome, is due to impaired bile salt secretion (similar to type 1), but is related to the ABCB11 gene that encodes the bile salt export pump, or BSEP. PFIC type 3 (PFIC3) is due to impaired biliary phospholipid secretion that is related to a defect in the ABCB4 gene that encodes the multi-drug resistant 3 protein, or MDR3.

PFIC is suspected to be the cause of cholestasis in 10-15% of children, and is also the underlying cause of liver transplants in 10-15% of children. The exact prevalence remains unknown, but is estimated to be between 1 in every 50,000-100,000 births. PFIC1 and PFIC2 account for 2/3 of all PFIC cases, with PFIC3 making up the other 1/3. PFIC is present worldwide, and there does not appear to be a gender predilection.

The main clinical manifestation in all forms of PFIC, hence the name, is cholestasis, and will usually appear in the first few months of life with PFIC1 and PFIC2. Recurring episodes of jaundice are also present in PFIC1, whereas permanent jaundice and a rapid evolution to liver failure are characteristic of PFIC2. In PFIC3, cholestasis is noted within the first year of life in 1/3 of all cases, but rarely will be present in the neonatal period. PFIC3 can also present later in infancy, childhood or even early adulthood, with gastrointestinal bleeding due to portal hypertension and cirrhosis being the main symptoms that the patient would present with. Pruritus is severe in PFIC 1 and 2, but has a more mild presentation in PFIC3. There have been multiple cases reported of hepatocellular carcinoma that are associated with PFIC2, but there so far have not been any cases of hepatocellular carcinoma reported that are associated with PFIC3. Other signs and symptoms that may be present in PFIC1 include short stature, deafness, diarrhea, pancreatitis and liver steatosis. When examining clinical laboratory results, patients with PFIC1 and PFIC 2 will have normal serum gamma-glutamyltransferase (GGT) levels, but patients with PFIC3 will have elevated GGT levels. PFIC1 and PFIC2 can be differentiated from each other by the higher transaminase and alpha-fetoprotein levels that are found in PFIC2. When analyzing the biliary bile salt concentrations, PFIC1 will have mildly decreased levels (3-8 mM), PFIC2 will have drastically decreased levels (<1 mM), and PFIC3 will have normal levels. In addition, the biliary bile salt:phospholipid ratio and the cholesterol:phospholipid ratio will be approximately 5 times higher in PFIC3 than in normal bile, due to the biliary phospholipid levels being dramatically decreased (normal phospholipid range = 19-24%, PFIC phospholipid range = 1-15%).

Histologically, PFIC1 and PFIC 2 will have canalicular cholestasis, an absence of true ductular proliferation, and periportal biliary metaplasia of the hepatocytes. In PFIC2, these manifestations are much more worrisome with more marked lobular and portal fibrosis, and inflammation, as well as having much more pronounced necrosis and giant cell transformation (Images 3 and 4). PFIC3 will show portal fibrosis and true ductal proliferation, with a mixed inflammatory infiltrate. In addition, cholestasis can be present in the lobule and in some of the ductules that contain bile plugs. Cytokeratin staining can help confirm the ductular proliferation within the portal tract. Mild or absent canalicular staining with BSEP and MDR3 antibodies will help to diagnose PFIC2 and PFIC3, respectively.

Image 3. Photomicrograph demonstrating cholestasis, centrilobular necrosis, lobular inflammation, and giant cells (H&E)
Image 4. Photomicrograph demonstrating portal, centrilobular and bridging fibrosis (Trichrome)

A diagnosis of PFIC is based on the clinical manifestations, liver ultrasonography, cholangiography and liver histology, as well as on specific tests for excluding other causes of childhood cholestasis (such as biliary atresia, Alagille syndrome, cystic fibrosis and alpha-1 antitrypsine deficiency). Ultrasonography of the liver will be normal with the exception of a possible dilated gallbladder. At the time of the liver biopsy, a portion of tissue can be submitted for electron microscopy, which in the case of PFIC, can show canalicular dilatation, microvilli loss, abnormal mitochondrial internal structures, and varying intra-canalicular accumulations of bile. PFIC1 will have coarsely, granular bile on electron microscopy, whereas PFIC2 will have a more amorphous appearance. If biliary obstruction is noted on the liver biopsy, a cholangiography will need to be performed to exclude sclerosing cholangitis. If a normal biliary tree is observed, as in PFIC, bile can be collected for biliary bile salt analysis (which was discussed earlier in the laboratory results section). Differentiating between PFIC1, PFIC2 and PFIC3 can be quite troublesome, but luckily Davit-Spraul, Gonzales, Baussan and Jacquemin proposed a fantastic schematic for the clinical diagnosis of PFIC, which is presented as Figure 1.

Figure 1. Schematic proposed for the clinical diagnosis of progressive familial intrahepatic cholestasis

Ursodeoxycholic acid (UDCA) therapy should be considered in all patients with PFIC to prevent liver damage and provide relief from pruritus. Rifampicin and Cholestyramine can help in cases of PFIC3, but have been found to provide no improvement in PFIC1 or PFIC2. In some PFIC1 or PFIC2 patients, biliary diversion can also relieve pruritus and slow disease progression. The total caloric intake should be around 125% of the recommended daily allowance. Dietary fats should come in the form of medium chain triglycerides, and care should be taken to check the patient’s vitamin levels to look for signs of vitamin deficiency. Patients with PFIC2 should be monitored for hepatocellular carcinoma, beginning from the first year of life. Ultimately, most PFIC patients develop fibrosis and end-stage liver disease before adulthood, and are candidates for liver transplantation. Diarrhea, steatosis and short stature may not improve after liver transplantation, and could become aggravated from the procedure. Hepatocyte transplantation, gene therapy or specific targeted pharmacotherapy are possible alternative therapies for PFIC, but will require more research and studies to determine whether they are viable options.

References

  1. Davit-Spraul A, Gonzales E, Baussan C, Jacquemin E. Progressive familial intrahepatic cholestasis. Orphanet J Rare Dis. 2009;4(1). doi:10.1186/1750-1172-4-1
  2. Evason K, Bove KE, Finegold MJ, et al. Morphologic findings in progressive familial intrahepatic cholestasis 2 (PFIC2): correlation with genetic and immunohistochemical studies. Am J Surg Pathol. 2011;35(5):687–696. doi:10.1097/PAS.0b013e318212ec87
  3. Srivastava A. Progressive Familial Intrahepatic Cholestasis. J Clin Exp Hepatol. 2013;4(1):25-36. doi: 10.1016/j.jceh.2013.10.005

-Cory Nash is a board certified Pathologists’ Assistant, specializing in surgical and gross pathology. He currently works as a Pathologists’ Assistant at the University of Chicago Medical Center. His job involves the macroscopic examination, dissection and tissue submission of surgical specimens, ranging from biopsies to multi-organ resections. Cory has a special interest in head and neck pathology, as well as bone and soft tissue pathology. Cory can be followed on twitter at @iplaywithorgans.

Sex Hormones in Competitive Athletics

Image 1. Photo from NBC News.

Given my previous work in lab value changes in transgender individuals on hormone therapy, I was recommended to consider discussing the case of Olympic mid-distance runner, Caster Semenya. Although she is not transgender, this professional runner from South Africa has won her last 30 races and been scrutinized for her muscular build as having potentially higher levels of testosterone, a condition called hyperandrogenism. The International Olympic Committee’s (IOC) regulations require testosterone levels to be below a certain threshold for female athletes. 

While no competitor can achieve great victories without hard work and practice, there are certainly examples of outliers whose genetics give them an advantage. However, I don’t think we would endorse shortening Michael Phelps’ arms or lobotomizing chess master Bobby Fisher to decrease their inborn advantages for a level playing field.

But this gets into an area of ethics that I’m not an expert on, so instead I will stick to my area of science and examine what evidence may exist to support the IOC’s policy. Then I will extrapolate the results from our study of transgender individuals to see if hormone regulation may impact contributions to athleticism. The most strongly shifted lab values in hormone therapy for transgender individuals are red blood cells (including oxygen-carrying hemoglobin) and creatinine (byproduct of muscle used to monitor kidney function, but also reflects total muscle mass).

Once looking more closely at this topic, I realized there is a lot to say about the contributions of 1) muscle mass and 2) red blood cells to athleticism. So, I will discuss muscle mass this month and wait until next month to discuss hemoglobin levels (including athletic performance by blood removal/ doping).

Mid-distance running, which is Caster Semenya’s sport, is a mix of anaerobic and aerobic activity. This means having more muscle would be advantageous. This is supported by a study that was commissioned by the IAAF (International Association of Athletics Federation), which shows a 1.8-2.6% increased competitive advantage in short distance track events (400m, 800m and, 400m hurdles)1. However, this study had several limitations. First, the sample size was quite low with only 22 female athletes. Next, they use a p-value of 0.05 for significance without correction for multiple hypothesis testing (21 hypotheses tested representing each event), which increases the likelihood of a false positive result by chance.

What makes me curious is whether following the International Olympic Committee’s recommendations of lowering testosterone levels would even have a meaningful impact and improve competitiveness?

From my research, I know that adding testosterone to individuals assigned female at birth to transition to transgender males (TM ) does substantially increase creatinine (p<0.005, Figure 1)2 to male levels (baseline TW). This is likely not due to changes in kidney function (although this has not yet been proven), but rather due to increased muscle mass.

Figure 1.

However, the inverse is not quite true for transgender women who take combinations of estrogen for feminization and spironolactone to block the effects of testosterone. In these patients, we see a slight decrease in the creatinine (TW). While this decrease is statistically significant, the range is not clinically different from male creatinine levels. This concurs with the observations that musculature in transgender women does not change substantially upon taking hormone altering medication.

A more rigorous examination of muscle mass, performed by MRI measurement, determined that after 1 year of hormone therapy testosterone increased muscle mass in transgender men to biological male levels3, similar to our observations of creatinine. Further, they saw a significant reduction in muscle mass from baseline of transgender women on hormone therapy for 12 months, but it was still much higher than the muscle mass of biologic females4.

Therefore, were Casten Semenya to take testosterone blocking medication, I suspect there would be little impact on her overall muscle mass. Which is one of, if not the explicit purpose of taking testosterone lowering medicine. The strength of my conclusions is limited by the fact that we don’t know Casten Semenya’s testosterone levels, and furthermore a hyperadrogenic female is not the same as a male-to-female transgender woman.

As mentioned above, I will continue this discussion next month with an exploration of how testosterone lowering therapy could affect red blood cell levels, which would affect athletic performance differently.

References

  1. Bermon S and Garnier P. Serum androgen levels and their relation to performance in track and field: mass spectrometry results from 2127 observations in male and female elite athletes. British Journal of Sports Medicine. 2017; 51(17): 1309-1314.
  2. SoRelle JA, Jiao R, Gao E et al. Impact of Hormone Therapy on Laboratory Values in Transgender Patients. Clin Chem. 2019; 65(1): 170-179.
  3. Gooren LJ, Bunck MC. Transsexuals and competitive sports. Eur J Endocrinol. 2004; 151(4): 425-9.
  4. Jones BA, Arcelus J, Bouman WP, Haycraft E. Sport and Transgender People: A Systematic Review of the Literature Relating to Sport Participation and Competitive Sport Policies. Sports Med. 2017;47(4):701-716.

-Jeff SoRelle, MD is a Molecular Genetic Pathology fellow at the University of Texas Southwestern Medical Center in Dallas, TX. His clinical research interests include understanding how the lab intersects with transgender healthcare and advancing quality in molecular diagnostics.

Safety Mistakes Your Lab Vendors Are Making

Laboratory professionals work with vendor representatives on a regular basis, and it is important to develop a good working relationship with them to ensure continued smooth operations in the department. They provide analyzers, products, equipment, and services. However, lab managers and employees may sometimes need to pay special attention to the actions a representative will take in the department or to some of the information they may provide. They should be experts about their products and processes, but they may not always be well-versed in your lab-specific process and the regulations.

One common safety mistake representatives make has to do with proper use of personal protective equipment (PPE). Not all vendors provide adequate PPE training, and many of the representatives may not have a laboratory background. Check to make sure vendors wear lab coats and gloves when working in the lab, and offer face protection if they open up instruments for repairs or diagnostics. Some reps bring their own lab coats and use them in different settings where they work. This is common, but it is also a violation of OSHA’s Bloodborne Pathogens standard. PPE used in a lab should never be taken out of the department (except as waste). Don’t let your vendor roll up his used lab coat and place it into his work bag for his next stop. Let him know about the regulations and offer him a new disposable coat upon each visit.

Another common issue with lab vendor reps is the use of laptop computers and cellphones in the laboratory. In some cases, they must use their computers to connect to instruments or to the company control center, but they should be decontaminated before removal from the department, especially if they were set on top of a lab counter or analyzer. Can reps use lab phones instead of their cell phones? It’s a worthwhile question, especially if cell phone use is against your lab policy (it should be), and if allowing vendor use of the cell phone will be a detriment to your lab’s safety culture. Again, as with PPE use, this safety knowledge may not be known by the vendor company, and certainly they need education about local policies as well.

Laboratory vendors that manufacture analyzers or that design testing processes know their products inside and out, but their set-up work and lab staff training should be monitored, particularly if the information pertains to local or state regulations. For example, some lab analyzers are put in place using an extension cord for power because the analyzer cord doesn’t reach the outlet. In many locales, the permanent of an extension cord is not permitted. Often a vendor will train staff to incorrectly dispose of bio-hazardous or chemical waste. That can lead to large citations and fines if the mistakes are not caught and corrected. If a new process or analyzer generates a new waste stream, be sure all waste regulations are being followed. For example, if an instrument waste line is tied to a drain, contact your local wastewater treatment center to obtain approval for drain disposal.

Labs need vendors and their representatives, they play a vital role making sure the department can provide quality patient testing and care. Be sure these valuable team members understand your operations, and provide lab safety training in order to prevent injuries or even lab-acquired infections. Ask questions, and communicate with the vendor to ensure that all lab safety procedures are being followed and that safety regulations are not violated. Keeping that eye on safety when dealing with vendors will help to ensure that the important relationships created with them will last.

Dan Scungio, MT(ASCP), SLS, CQA (ASQ) has over 25 years experience as a certified medical technologist. Today he is the Laboratory Safety Officer for Sentara Healthcare, a system of seven hospitals and over 20 laboratories and draw sites in the Tidewater area of Virginia. He is also known as Dan the Lab Safety Man, a lab safety consultant, educator, and trainer.