Introduction
Primary Biliary Cholangitis (PBC), formerly known as Primary Biliary Cirrhosis, is a chronic autoimmune disorder that gradually destroys the small bile ducts of the liver. This progressive destruction results in inflammation and cholestasis. Prolonged hepatic cholestasis results in fibrosis and cirrhosis and, if left unmanaged, ultimately, liver failure. This article aims to provide key insights into this rare condition.
Overview
Primary biliary cholangitis is considered an autoimmune disease in that liver injury is sustained by the presence of self-directed anti-mitochondrial antibodies (AMA) that target the bile duct cells.1 While PBC remains elusive, studies suggest that the combination of environmental triggers and genetic factors elicit PBC. Environmental triggers may include exposure to toxic chemicals, smoking cigarettes, and infections such as urinary tract infections.2 The inflammation that occurs in PBC is thought to result from a direct insult of environmental factors and toxins.3 Sex and age may also increase the risk of PBC, as it is more common among women worldwide and generally diagnosed between the ages of 30-60.2 Prognosis may be dependent on early detection and response to treatment.
Presentation
In the early stages, most patients may be asymptomatic, as up to 60% of patients do not exhibit signs or symptoms at diagnosis.4 Common early symptoms may include fatigue and itchy skin. Later signs and symptoms of PBC may include jaundice, ascites, upper right quadrant abdominal pain, splenomegaly, bone, muscle, and joint pain, steatorrhea, osteoporosis, dry eyes and mouth, xanthomas, hyperpigmentation, and hypothyroidism.2 These symptoms may affect people to varying degrees; they can occur earlier or later in the disease course and may appear mild to severe at any stage.5 Incidentally, asymptomatic patients may be diagnosed when blood tests are ordered for other reasons, such as routine testing.2

Lab Findings
Tests to diagnose PBC may include imaging tests, blood tests, and liver biopsy. The diagnostic criteria for PBC include an absence of any other liver disease, no signs of extrahepatic biliary obstruction on imaging tests, and at least 2 out of 3 of the following:
• Elevation of alkaline phosphatase (ALP) at least 1.5 times the upper limit of normal
• The presence of anti-mitochondrial antibody (AMA) with a titer of 1:40 or higher
• Histopathological evidence of primary biliary cirrhosis.3
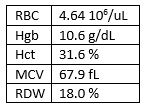
Those patients who are asymptomatic with abnormal liver chemistry, specifically abnormal ALP, should be evaluated for PBC. Also, patients experiencing nonspecific right upper quadrant pain, unexplained itching, fatigue, jaundice, hyperpigmentation, or unintentional weight loss should be assessed for PBC.3 In cases of atypical disease presentation with elevated ALP but normal AMA, alternative diagnoses should be explored, and a liver biopsy may be necessary for confirmation.3 However, it is important to note that liver biopsy is not required for diagnosis; instead, it is helpful in disease prognosis and staging. Patients with primary biliary cholangitis may develop iron deficiency anemia secondary to chronic blood loss caused by portal hypertensive gastropathy. In addition to anemia, patients who have already developed cirrhosis may have an elevated prothrombin time (PT), thrombocytopenia, and leukopenia.3
Treatment and Management
The key aim of therapy for primary biliary cholangitis is to halt disease progression while addressing the symptoms and complications associated with chronic cholestasis. Medications approved by the Food and Drug Administration (FDA) are currently available to help slow disease progression. Among FDA-approved treatments, Ursodeoxycholic acid (UDCA) is the most commonly prescribed and typically used as the first line of therapy. While UDCA does not cure primary biliary cholangitis (PBC), it aids in bile flow through the liver and has been shown to improve liver function and slow the progression of liver scarring.² However, additional therapies are often needed to manage symptoms such as fatigue, itching, dry eyes and mouth, and other complications associated with PBC.
Conclusion
Primary biliary cholangitis (PBC) is a rare but significant autoimmune disorder that progressively damages the liver, leading to cholestasis, fibrosis, and potentially liver failure if untreated. Early detection and intervention are crucial in mitigating disease progression and managing associated symptoms. Diagnostic criteria, including the presence of AMA and elevated ALP, play a pivotal role in identifying PBC, even in asymptomatic patients. Effective therapies like ursodeoxycholic acid (UDCA) have demonstrated their ability to slow progression and improve patient outcomes, though addressing symptoms and complications remains a critical component of care. By understanding the pathophysiology, presentation, and treatment of PBC, healthcare providers can better support patients with this challenging condition.
References
1Lenci I, Carnì P, Milana M, Bicaj A, Signorello A, Baiocchi L. Sequence of events leading to primary biliary cholangitis. World J Gastroenterol. 2023 Oct 7;29(37):5305-5312. doi: 10.3748/wjg.v29.i37.5305. PMID: 37899786; PMCID: PMC10600805.
2Mayo Clinic [Internet]. Rochester (MN): Mayo Foundation for Medical Education and Research; c1998-2025. Primary biliary cholangitis: symptoms and causes; [updated 2023 Sep 20; cited 2025 Jan 21]; [about 3 p.]. Available from: https://www.mayoclinic.org/diseases-conditions/primary-biliary-cholangitis/symptoms-causes/syc-20376874
3Pandit S, Samant H. Primary Biliary Cholangitis. [Updated 2023 Feb 12]. In: StatPearls [Internet]. Treasure Island (FL): StatPearls Publishing; 2025 Jan-. Available from: https://www.ncbi.nlm.nih.gov/books/NBK459209/
4Ipsen Biopharmaceuticals [Internet]. Map PBC; [updated 2024 Aug; cited 2025 Jan 21]; [about 2 p.]. Available from: https://www.mappbc.com/?gclsrc=aw.ds&gad_source=1&gclid=EAIaIQobChMIreWL_pWgigMV7Ub_AR2q_ygQEAAYBCAAEgL83vD_BwE
5Cleveland Clinic [Internet]. Primary Biliary Cholangitis (PBC): Overview; [updated 2023; cited 2025 Jan 21]; [about 3 p.]. Available from: https://my.clevelandclinic.org/health/diseases/17715-primary-biliary-cholangitis-pbc#overview

-Kaysi Bujniewicz, MLS(ASCP)CM graduated Magna Cum Laude from University of North Dakota School of Medicine with a Bachelor of Science in Medical Laboratory Science. She has worked in clinical laboratories for over eight years as a certified and licensed Medical Laboratory Technician and a Medical Laboratory Scientist. Although her true callings are in Immunohematology and Clinical Microbiology, she currently works as a Generalist.