Laboratory process vignette
Prior to my arrival in the laboratory in April 2020, we had a written procedure to repeat any cerebrospinal fluid (CSF) HSV-1 or -2 positives with a CT value >38. Upon arriving I was asked by our molecular supervisor if I wanted to keep this rule. Not having specific experience with this instrument and assay and knowing this was an FDA approved direct sample to answer assay, I asked “what does the package insert (PI) say?” When I reviewed the PI and further discussed with our supervisor, we decided this was not in the PI and even though we could review the curves, we should treat results from this assay like a “black box” direct sample to answer assay. The black box being referred to here, is a sample to answer instrument in which the cycle threshold (Ct) values are not visible to the user.
We updated the procedure to report the results that the assay produced and removed repeating any results that were not invalids or errors.1 This decision was based on several factors. 1. Repeating high CT value results are likely testing a bioburden that is near the limit of detection (LOD) and could repeat as positive but repeating as negative does not invalidate the first positive result. 2. The picture could get muddied by changing a positive to a negative based on a repeat result. Calling the clinician with conflicting results was more confusing to the provider than the provider reaching out to say the positive did not make sense and then sharing the high CT value. 3. We had no basis, ie validations to demonstrate that the higher CT values were not reliable/accurate. College of American Pathologists checklist item, CAPMIC.64975 Modified Cut-Off Phase II “If the laboratory has modified the manufacturer’s cut off-value for a positive result, the new cut-off value has been validated.”2
Technologist vignette
While this repeat was removed from policy, my team remained vigilant of when those high CT values would report out.
One weekend out of previous habit, a CSF HSV-1 PCR positive with high CT 37.9 was repeated and it was negative. The weekend consult I received was “Should I report the original positive or the repeat negative? I’m reviewing the CSF cell counts and seems like the positive could be real?” After review and discussion, this repeat was a result of still being nervous about the higher CT value and repeating even though it was no longer in the policy. This also ended up being a missed opportunity for contamination check because the repeat test was performed after disinfecting the instrument. Environmental swabs and QC were not run before that second test. Was it potential contamination or was it just a low level positive? The positive was reported and the clinician did not have additional questions.
Pediatric Infectious Disease Provider Vignette
One week later, I was alerted to a pediatric patient with CSF HSV-1 PCR positive result with a high CT value (39.4) but the Enterovirus (run on a separate instrument) was also positive at a CT value of 27.4. Both positive results were posted in the EMR and I was consulted by the pediatric ID provider requesting consultation on validity of results. I shared that seeing this very high CT value paired with the Enterovirus makes me consider the possibility of a false positive. With the predominance of HSV in the community a false positive can be introduced at any point including specimen collection. To alleviate laboratory contamination concerns, environmental testing was performed with no indication of contamination. I assured the physician that there is no additional manipulation of the specimen once in the lab other than testing setup. I shared repeat testing will not be helpful. Repeat testing was not requested on the original specimen. Our ID provider was on board with ruling it a contaminant or insignificant to the diagnosis after a repeat CSF was collected and tested negative.
Phone a Friend Vignette
This prompted me to have a conversation with a colleague about these results. I learned that at their institution they incorporated a comment for any CT value >=35. “This specimen yielded a low positive result, which may not be reproducible and should be interpreted in the context of the patient’s clinical presentation.” We opted to adopt this statement at our institution to aid us in conversations with providers. At the LOD, it will be challenging to confirm the results as there really isn’t a way to do it without uncertainty surrounding the results.
Adult Hospitalist Investigation Vignette
Almost one year later I received an email forwarded to me by our medical director from a physician that was sharing concern over our HSV-2 test results.
“Over my ten-year career, I have encountered only a handful of HSV-2 cases. Interestingly, in the last two months alone, I’ve observed three HSV-2 cases in the same unit!!
In the first two cases, the CSF profiles were remarkably benign, making an HSV-2 positive result highly unexpected. Despite this, both patients tested positive for HSV-2 (4/18 and 5/17) and were treated accordingly.
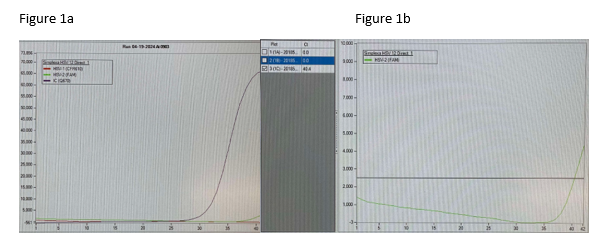
The third case involved a patient diagnosed with cryptococcal meningitis, which accounted for the CSF findings. However, the HSV-2 test also returned positive (6/5), which was surprising given the extremely low likelihood of concurrent infection with cryptococcal meningitis and HSV-2. After initiating treatment with amphotericin, the patient began to improve. When the HSV-2 results came back, we started acyclovir. However, two additional samples taken within 24 hours both tested negative. It is well-documented that true HSV-2 infections typically maintain positive results for an extended period, even with appropriate treatment.
Given these observations, I am concerned that we may be dealing with laboratory errors, leading to the overtreatment of patients based on false positives.
Could you please investigate these cases further?”
My response as Infectious Diagnostics Director
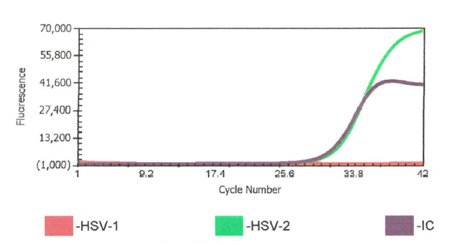
Good afternoon concerned provider. We conducted a review of our results, quality control (QC), and have corresponded with the manufacturer. We have had no QC contamination monitoring concerns. The result PCR curves did not demonstrate anything questionable (the result appears to be a real positive without abnormal signaling). All three of the patients you shared had results that were at the lower end of detection. While, the manufacturer, did not recommend to do this, we do add a comment for CT values >35 (towards the lower LOD) that the specimen yielded a low positive result which may not be reproducible and should be interpreted in conjunction with patient presentation. Snip from chart below. Any tests at the lower limit of detection are challenging because when virus is truly there it will likely not repeat. We will be monitoring this closely and continue to report trends to the manufacturer and continue to monitor our internal quality control per protocol and review the need for added quality control monitoring with other users.
Low pre-test probability does increase the risk of false positives, however, this test has been cited in the literature to have high accuracy, but this may be skewed toward truly positive cases. The test we use is a targeted assay as described in the attached article3. We are in process of pushing forward an investigation with the manufacturer and I will share if there are further findings.
If you’d like to chat to better understand any of this you can reach me via secured messaging or my cell.
The follow up discussions
The provider did want to have further conversation because the HSV-2 positive result simply did not make clinical sense to him. After discussing and not being satisfied by the possibility of low level HSV-2 in the CSF, I offered a review by our infectious diseases providers. Infectious disease was involved in all three cases during their encounter.
For the first case, ID provider shared that CSF does not correlate with HSV but clinically with mental status change there was no other clear source of encephalopathy. For the second case, the CSF cell count did not correlate with HSV but since patient had a prior history of transplant and was on immunomodulator there was a high risk for mollaret meningitis, rare form of meningitis that is recurrent, aseptic, mild, and self-limiting, HSV-2 being the most commonly associated agent. At the time of initial treatment, patient had mental status change. The third case was deemed to be either a contaminant or false positive by the ID provider consulted. This assessment was made since his abnormal CSF was explained by patient’s Cryptococcal meningitis and the repeat HSV was negative without treatment.
Only 1 of the 3 was fully confirmed by ID to be considered a contaminant. Given the prevalence of HSV-1 and HSV-2 at various body sites among the healthy population, human contamination is a necessary consideration for providers when the results do not make clinical sense.
What we did and what we changed
Following multiple emails and conversations with the manufacturer scientific liaison in which we reviewed each curve that was questioned, we did not change our response to the provider. However, we gained valuable insight into what an instrument contaminant would look like and we simply did not see any of that. We saw clean curves that came up at later cycles.
We learned of the recommended high touch surface areas to test for environmental testing and the use of a blue plate to minimize contact with the loading disc for testing.
We will likely continue to see high CT values, get questions about potential false positives (some of these stories are patient driven, even when the patient has a previous history and consistent CSF profile), and continue to have in depth conversations with our providers.
What would you do? Better yet – what do our physicians do then? In our case our provider was not comfortable with the response and requested ID review.
What do you do? Please share as we are constantly learning from each other.
References
- Diasorin Molecular SimplexaTM HSV 1&2 Direct package insert for both Cerebrospinal fluid and cutaneous and mucocutaneous lesion swabs.
- CAP Microbiology Checklist 2023
- Gaensbauer JT, Fernholz EC, Hiskey LM, Binnicker MJ, and Campioli CC. Comparison of two assays to diagnose herpes simplex virus in patients with central nervous system infections. Jour Clin Vir. 166(2023) 105528. DOI: 10.1016/j.jcv.2023.105528

-Kimberly Mckean, MLS(ASCP)

-Frances Valencia-Shelton, PhD, D(ABMM), SM(ASCP)CM is the Clinical Infectious Diagnostics Director for the Baptist Health System in Jacksonville, FL. She is actively engaged in the Jacksonville Area Microbiology Society and the American Society for Microbiology. Her interests include defining and utilizing clinical best-practice for testing and reporting. She is equally interested in learning with and educating others in the field of clinical microbiology.