Case 1: Premature newborn with abnormal reticulocyte scattergram, indicated by the * after the parameters. The sample was rerun with a 1:5 dilution to minimize interference. CBC and Retic results shown below.

In this case the dilution was able to minimize interference, so there is no longer an abnormal scattergram flag. After diluting the sample, the HCT was multiplied by the dilution factor. The MCV, Reticulocyte % and Immature Reticulocyte Fraction (IRF) are not multiplied because these are % and fractions or ratios so do not change.
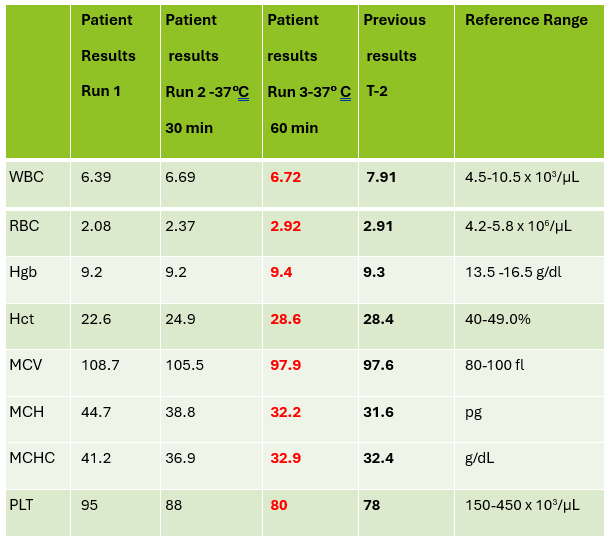
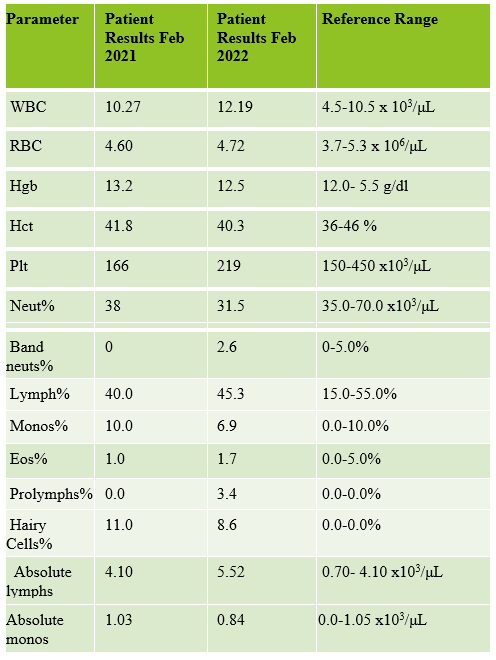
Case 2: 48-year-old woman with sickle cell anemia with abnormal reticulocyte scattergram. The sample was rerun with a 1:3 dilution to minimize interference. CBC and reticulocyte results are shown below.

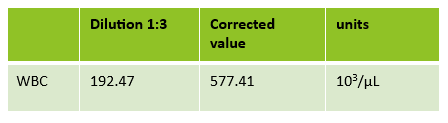
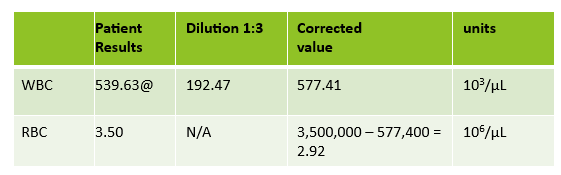
In this case, there is still an * after the reticulocyte % and Immature Reticulocyte Fraction (IRF) indicating that the dilution did not help minimize the interference in the scattergram. In Case 1 a 1:5 dilution was used. In this sickle cell patient, the red blood cell (RBC) count is too low to do a higher dilution. (The raw RBC with the 1:3 dilution was .69. On our analyzer it is important not to dilute a sample so that the RBC would be <0.5 as this suppresses the analyzer flags) This means that reticulocyte results could not be reported from the analyzer, and it was necessary to verify the reticulocyte count with a manual reticulocyte count.
I’ve often said that I really love working in Hematology, especially when these problem specimens come along. About 85% of our CBC’s autovalidate, so it’s easy to say that those aren’t too interesting. It’s the ones that need our attention that that are interesting and give us the opportunities to really use all the theory we learned in school. Some of our most challenging specimens are those with abnormal scattergrams or that have other results that just don’t make sense without further investigation and further work. Yes, they take more time but that’s what we are here for!
I work at a hospital that has a large oncology center where many sickle cell patients are treated. We also have the largest number of babies delivered in the area, and because of that there are many NICU babies. One thing these patients have in common is both populations tend to lean towards spurious reticulocyte counts with reticulocyte abnormal scattergram flags. But why?
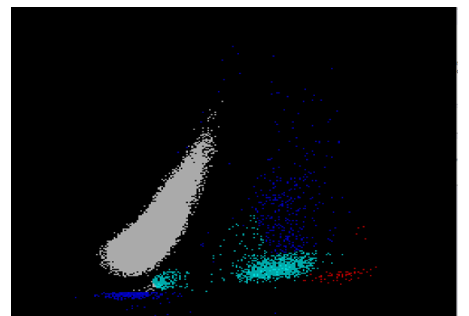
The reticulocyte (retic) count is a good marker of erythropoietic activity of the bone marrow. Retic counts, along with the Immature Reticulocyte Fraction (IRF) are useful tools to help diagnose anemia or monitor bone marrow response to therapy. Reticulocytes are a normal stage in the development of RBCs after the nucleus has been extruded but before the cell is mature. Retics still contain RNA which is lost upon cell maturation. On automated hematology analyzers, RBCs are counted using impedance or optical technology. Automated reticulocyte counts are based on identifying young RBCs which have residual nucleic acids after expelling the nucleus. Hematology analyzers stain the RNA in young RBCS with fluorescent or non-fluorescent dyes, and principles of impedance, scatter, fluorescence and flow cytometry are used to measure the immature cells. Reticulocytes have some leftover nucleic acid content, and the youngest reticulocytes, newly out of the bone marrow have even more nucleic acid content. This causes more fluorescence intensity. On analyzers using fluorescence, reticulocytes are separated from mature RBCs by light scatter based on their fluorescence intensity. The total reticulocyte population is separated into 3 fractions of low, medium, and high fluorescence. The percentage of medium plus highly fluorescent reticulocytes represents the youngest of the young RBCs, which is the IRF. These can be visualized on the retic scattergram (figure 1).

On an extended scattergram, signals with fluorescence intensity between reticulocytes and WBCs represent the upper particle portion (UPP) (figure 2). Interference can be seen on automated reticulocyte scattergrams when there are cells that have more nucleic acid than reticulocytes. Howell-Jolly bodies are DNA remnants seen in Wright-stained RBCs after the nucleus is extruded. These may be found in patients after splenectomy or when splenic function is compromised. They appear as single round dark blue inclusions in RBCs. In patients with Howell-Jolly bodies, interference with the reticulocyte count may be seen, triggering abnormal scattergram flags. Other peripheral blood findings that contain more nucleic acid than mature RBCs and reticulocytes may also cause interference and abnormal scattergrams in the reticulocyte channel. These include shift reticulocytes, basophilic stippling, nucleated RBCs and parasites. In patients with extreme leukocytosis, abnormal numbers of WBCS and WBC fragments may interfere with automated reticulocyte counting.

Case 1
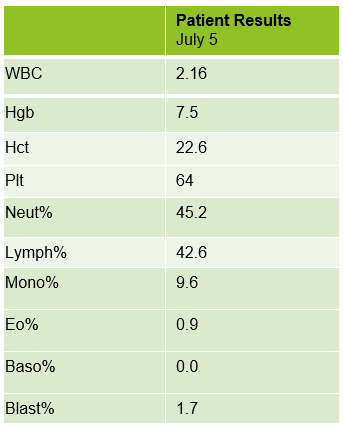
Newborns would be expected to have a higher percentage of reticulocytes than adults. Reference ranges for reticulocyte% in newborns is 2-6% compared to 0.5-1.5% for adults. Lower oxygen levels in the womb trigger the increased secretion of erythropoietin, which stimulates red blood cell (RBC) production. Increased production of RBCs results in a higher proportion of reticulocytes circulating in the newborn’s blood. In these cases, the bone marrow will release reticulocytes prematurely into the blood. These young reticulocytes that have more nucleic acid are called shift or stress reticulocytes. Premature infants may have even higher reticulocyte counts and more shift reticulocytes due to their accelerated development needs. As well, in babies with any form of hemolytic disease of the newborn, hemolysis is taking place, and a high reticulocyte count with shift reticulocytes is an indication that there is a compensation by producing more RBCs. In addition, oftentimes in these newborns, nucleated RBCs are present because the constant call for new RBCs leads to even more immature RBCs being released into the peripheral blood. Nucleated RBCs (nRBCs) are another interference factor in reticulocyte scattergrams.
In case 1 the newborn had an MCV of 103.3 which can be attributed to young RBCs known as reticulocytes. Reticulocytes are larger than mature RBCs because RBCs decrease in size with maturity. A high MCV and high reticulocyte(retic) count are therefore normal in newborns. A review of the smear on this baby showed nRBCs, basophilic stippling and slight polychromasia which all may interfere with automated reticulocyte counts. Diluting the samples reduced the interference and give us valid, reportable results.
Case 2
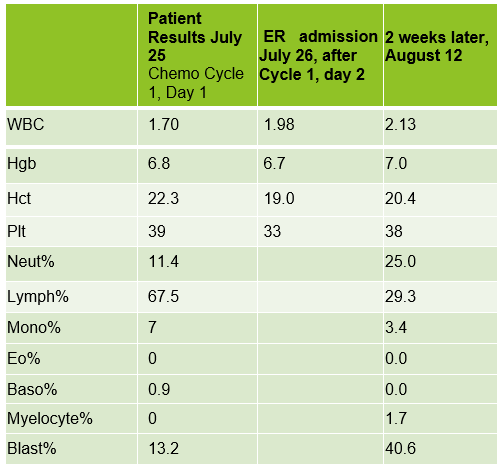
Sickle cell anemia is hemolytic anemia in which the abnormal sickle cells are being destroyed prematurely. Immature red blood cells including reticulocytes and shift reticulocytes are released prematurely from the bone marrow into the bloodstream in response to anemia, indicating the bone marrow’s attempt to compensate for a shortage of red blood cells. Sickle cell patients tend to have high reticulocyte counts, particularly during sickle cell crisis, have shift reticulocytes and often have nucleated RBCs, for the same reasons as premature newborns.
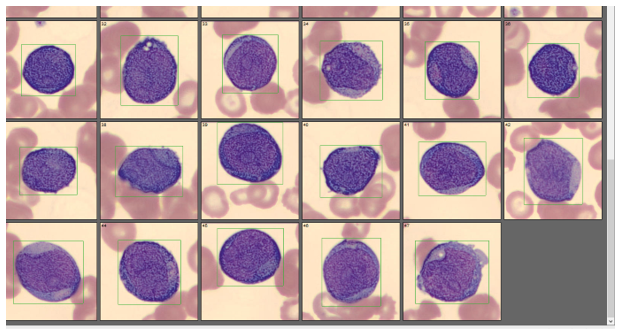
The smear on this patient showed numerous sickle cells, nRBCs, polychromasia, basophilic stippling, and Howell-Jolly bodies. In this case, however, the dilution did not eliminate the interference, and the abnormal reticulocyte flag was still present. A manual reticulocyte count using a Miller ocular was performed and the retic% was 3.2 %, quite a difference from the 12.8% and 9% from our analyzer! This illustrates the importance of resolving the discrepancy before reporting out a spurious count. After all, that’s why we have Medical Laboratory Scientists! Without our careful attention to detail, you’re just guessing.
References
Gaur M, Sehgal T. Reticulocyte count: a simple test but tricky interpretation! Pan Afr Med J. 2021 Sep 2;40:3. doi: 10.11604/pamj.2021.40.3.31316. PMID: 34650653; PMCID: PMC8490160.
Kim A, Park J, Kim M, Lim J, Oh EJ, Kim Y, Park YJ, Han K. Correction of pseudoreticulocytosis in leukocytosis samples using the Sysmex XE-2100 analyzer depends on the type and number of white blood cells. Ann Lab Med. 2012 Nov;32(6):392-8. doi: 10.3343/alm.2012.32.6.392. Epub 2012 Oct 17. PMID: 23130337; PMCID: PMC3486932.
Sysmex Customer Resource Center, Sysmex America, 2025
Uppal, V., Naseem, S., Bihana, I. et al. Reticulocyte count and its parameters: comparison of automated analyzers, flow cytometry, and manual method. J Hematopathol 13, 89–96 (2020). https://doi.org/10.1007/s12308-020-00395-8

-Becky Socha, MS, MLS(ASCP)CMBBCM graduated from Merrimack College in N. Andover, Massachusetts with a BS in Medical Technology and completed her MS in Clinical Laboratory Sciences at the University of Massachusetts, Lowell. She has worked as a Medical Technologist for over 40 years and has taught as an adjunct faculty member at Merrimack College, UMass Lowell and Stevenson University for over 20 years. She has worked in all areas of the clinical laboratory, but has a special interest in Hematology and Blood Banking. She currently works at Mercy Medical Center in Baltimore, Md. When she’s not busy being a mad scientist, she can be found outside riding her bicycle.