Working in Hematology, I have learned that things aren’t always black and white. With about 80-85% of our CBC’s autovalidating, it’s those other “problem child” specimens that can give us a challenge. When we get one of these tricky specimens, it’s time to put on our detective hats and investigate what is going on.
This patient was a 65-year-old female with Chronic Lymphocytic Leukemia (CLL). WBC and RBCs are counted on our analyzer by impedance, which sorts cells by size. When we ran this sample, we noticed a few things right away. See results below in Figure 1.

The first thing I notice on this specimen is the @ next to the WBC. This indicates that the count is over linearity and was confirmed by dilution. The corrected WBC was 577 x 103/mL. See Figure 2.

Extreme leukocytosis may interfere with the RBC, HGB, HCT and MCV determinations. The degree of RBC interference depends on the number and size of WBCs present. WBC and RBC are counted using impedance technology. In impedance counting, the RBC count is done first by passing the sample though the aperture in the RBC/platelet channel. This count is actually the sum of both RBC and WBC counts. Then, the RBCS are lysed and the WBCs are counted in the WBC channel. Normally, the WBC count has very little, if any, effect on the reported RBC count. Normal RBC counts are 4-6 million/μL. Normal WBC counts are a fraction of this, at about 5-10,000/μL. If the the RBC count is 3.50 x 10⁶/μL and the analyzer includes 10,000 WBCs in the count, this only changes the RBC to 3.51 x 10⁶/μL. (3,500,000 + 10,000 = 3,510,000). Because WBC counts are so much lower than RBC counts, even if a WBC count is 100,000, the effect on the RBC count is clinically insignificant. (3,500,000 + 100,000= 3,600,000 = 3.60 x 10⁶/μL) However, in this patient, the WBC count was 577,000/μL. After reviewing the smear and confirming the WBC count with a WBC estimate, we corrected the RBC count, by subtracting the WBC from the RBC. As you can see in figure 3 below, the extreme leukocytosis did affect the RBC count.

So, how does this affect the hematocrit? The next thing noticed right away is that the Hgb and Hct don’t follow the “rules of 3”. Now, we know that these rules really only hold true for normocytic, normochromic RBCS, but extreme leukocytosis can interfere with Hct determination. A Hgb of 9.2 g/dL and Hct 39.4% doesn’t look ‘right’. We have just corrected the RBC count, and now we need to ask ourselves how this can affect the Hct. The hematocrit is the packed cell volume, or the % of red blood cells per total volume of the sample. Since we now know that the RBC count is 2.92 x 10⁶/μL, not 3.50 x 10⁶/μL, we can correct the hematocrit. If you have a hematocrit centrifuge in your laboratory, a spun hematocrit can be used to determine the corrected hematocrit. After correcting the Hct, you must also correct the MCV using the following formula.
Corrected MCV (cMCV) = HCT(%) x 10/cRBC
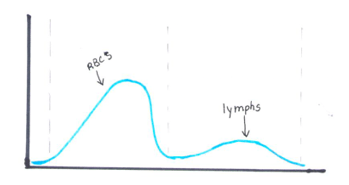
Another option for resolving interferences and correcting the Hct for extreme leukocytosis is using the clues that the RBC histogram gives us. We know the RBC count needed correcting, and we subtracted the WBC to get the corrected RBC. This sample had multiple flags. One of them was “Dimorphic population”. This indicates two populations of RBCs in the sample. Since we know a considerable number of WBCs were counted in the RBC chamber, this would account for the dimorphic population. A dimorphic population on histogram looks like what I call a ‘double humped camel’. In this case, the patient’s RBCs are the first, smaller population and the lymphocytes of this CLL patient are the 2nd larger population. See Figure 4.

Another option for recalculating the MCV is using the information in the service tab of your analyzer. Note that the results from the service tab are not FDA approved, and therefore not directly reportable, so must be confirmed first. If using values from the service tab, the spun hematocrit and calculations can be used as a check. The service tab displays the MCV of these 2 populations. These are listed as the MCV of the small population, S-MCV, and the MCV of the large cell population, L-MCV. Using the small MCV (sMCV) value and the corrected RBC (cRBC), we can back calculate the Hct using the following formula.
Corrected Hct (cHct) (%) = (sMCV x cRBC)/10
For this sample:
S-MCV = 105.1
L-MCV= 215.4
(cHct) (%) = 105.1 x 2.92/10 = 30.7 %
Hgb is another parameter that may be affected by extreme leukocytosis. Turbidity may be present in the diluted and lysed sample when reading the Hgb. This sample did not give us a Hgb turbidity flag, but because of the high WBC, the Hgb was confirmed using a diluted sample. The sample was diluted 1:3 with the analyzer diluent. Results were multiplied by the dilution factor. Lastly, when performing Hgb corrections (and in this case, also the RBC corrections) you must also recalculate the MCH and MCHC using the corrected values. Figure 5 shows these corrected values.
MCH (pg)= (cHgb/cRBC) x 10
MCHC (g/dL) =(cHgb/cHct) x 100

We can breathe a sigh of relief that we finally have accurate and reliable results for the CBC. But what about the differential? This big ugly grey mess seen in Figure 6 on the differential scattergram indicates a very abnormal scattergram. This is telling us that there is no separation between the types of cells. There were multiple flags for WBC abnormal scattergram, leukocytosis, lymphocytosis, and a flag for dimorphic RBC populations. These flags are all telling us not to accept the instrument results. In these cases, we want to review the smear, do a WBC estimate, and perform a manual differential, examining the differential carefully to look for any abnormalities. The differential had many lymphocytes and smudge cells. An albumin smear was made to resolve the smudge cells and a manual differential was performed.

I’ll admit that this type of specimen is not something we encounter every day (thankfully). But I thought it a very interesting example of a spurious results on many levels. These challenges are some of my favorite things about working in Hematology. Using autovalidation is a great tool in the laboratory to help workflow. With about 85% of specimens autovalidating, this allows us to spend time on these tricky specimens. And this tricky specimen was an epic one! We had CBCs on this patient several days in a row. Unfortunately, some of her results were simply repeated and reported. Some WBC results over linearity were reported without dilution. Other parameters were not corrected. This gives inconsistent and confusing results to the physicians and is not beneficial to the patient. Because of the inconsistencies, we issued a couple corrected reports which can be very time consuming. Sometimes we may not have the answers and can’t resolve a problem. If a specimen cannot be resolved, it is always better to report what you can and use ‘not reported’ or ‘not measured’ for any results that are not available. It’s better to report the good results that you have than to report junk that physicians can’t rely on. I often say that simply repeating a sample and reporting results if they match is not sufficient. We need to investigate spurious results so that we may report the best quality results possible for every patient.
References
- Gulati G, Uppal G, Gong J. Unreliable Automated Complete Blood Count Results: Causes, Recognition, and Resolution. Ann Lab Med. 2022 Sep 1;42(5):515-530. doi: 10.3343/alm.2022.42.5.515. PMID: 35470271; PMCID: PMC9057813.
- Sysmex USA. XN-Series Flagging Interpretation Guide. Document Number: 1166-LSS, Rev. 6, March 2021
- Zandcki, M. et al. Spurious counts and spurious results on haematology analysers: a review. Part II: white blood cells, red blood cells, haemoglobin, red cell indicies and reticulocytes. International Journal of Laboratory Hematology. 09January 2007.

-Becky Socha, MS, MLS(ASCP)CMBBCM graduated from Merrimack College in N. Andover, Massachusetts with a BS in Medical Technology and completed her MS in Clinical Laboratory Sciences at the University of Massachusetts, Lowell. She has worked as a Medical Technologist for over 40 years and has taught as an adjunct faculty member at Merrimack College, UMass Lowell and Stevenson University for over 20 years. She has worked in all areas of the clinical laboratory, but has a special interest in Hematology and Blood Banking. She currently works at Mercy Medical Center in Baltimore, Md. When she’s not busy being a mad scientist, she can be found outside riding her bicycle.
