Pitfalls of Artificial Intelligence for COVID-19 Variant Classification

While you have surely heard about all of the SARS-CoV-2 variants and how concerning they are, I would bet that you may not know how they are classified. Sure, from my last post, the technical aspects of whole genome sequencing and targeted approaches have been described, but bioinformatic (big data) analyses are essential to assign lineages. Furthermore, the advances of machine learning have been integrated into this system for SARS-CoV-2 lineage assignment.

How VOC lineages are given

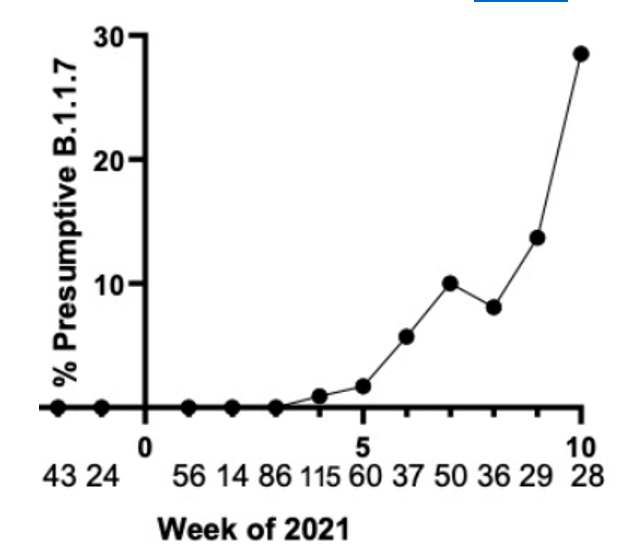
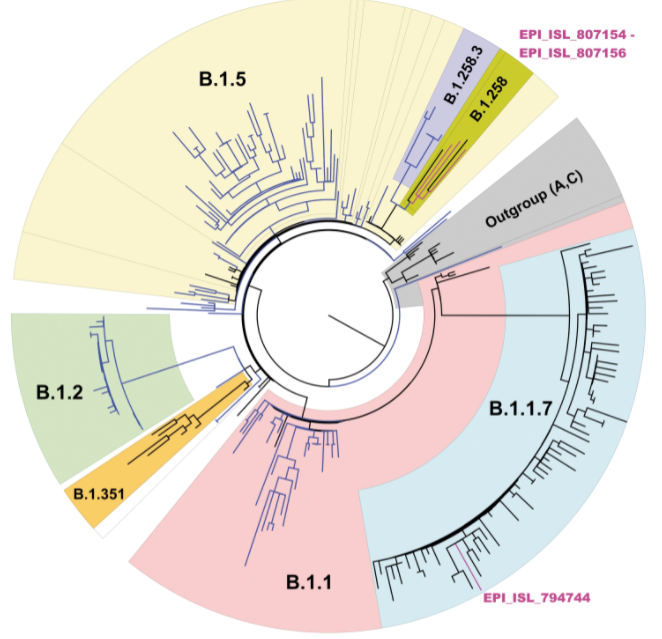
First, phylogenetic trees (circular example below) are formed to demonstrate relatedness of strains based on how many mutations they share. The more similar they are, the closer they are together. These trees are not new nor do they rely on artificial intelligence, but they can give visual clues as to whether a lineage is new.  For instance, when the first variant of concern B.1.1.7 (now called Alpha) was discovered, it branched away from other limbs of the phylogenetic tree.

Within these new viral variants, there are a set of mutations that are present in most of the viral variants. For instance, there are 17 protein coding changes in Alpha variant. However, these exact 17 mutations may not be in every Alpha variant. Individually, mutations may be present in 98% of isolates or lower; the spike gene deletion of amino acids 242-244 of the Beta variant (B.1.351, South Africa origin) is only present in 88% of specimens sequenced. This could be due to issues in sequencing, data processing, or just the prevalance/biology of the virus.

As there are many mutations that fit into certain variants, it would be difficult for a human to process all of this information in a probabilistic manner to assign lineages. Thus, machine learning tools (most common SARS-CoV-2 program is Pangolin) have been added onto the end of bioinformatic analyses to assign the lineage to a sample.

How machine learning works

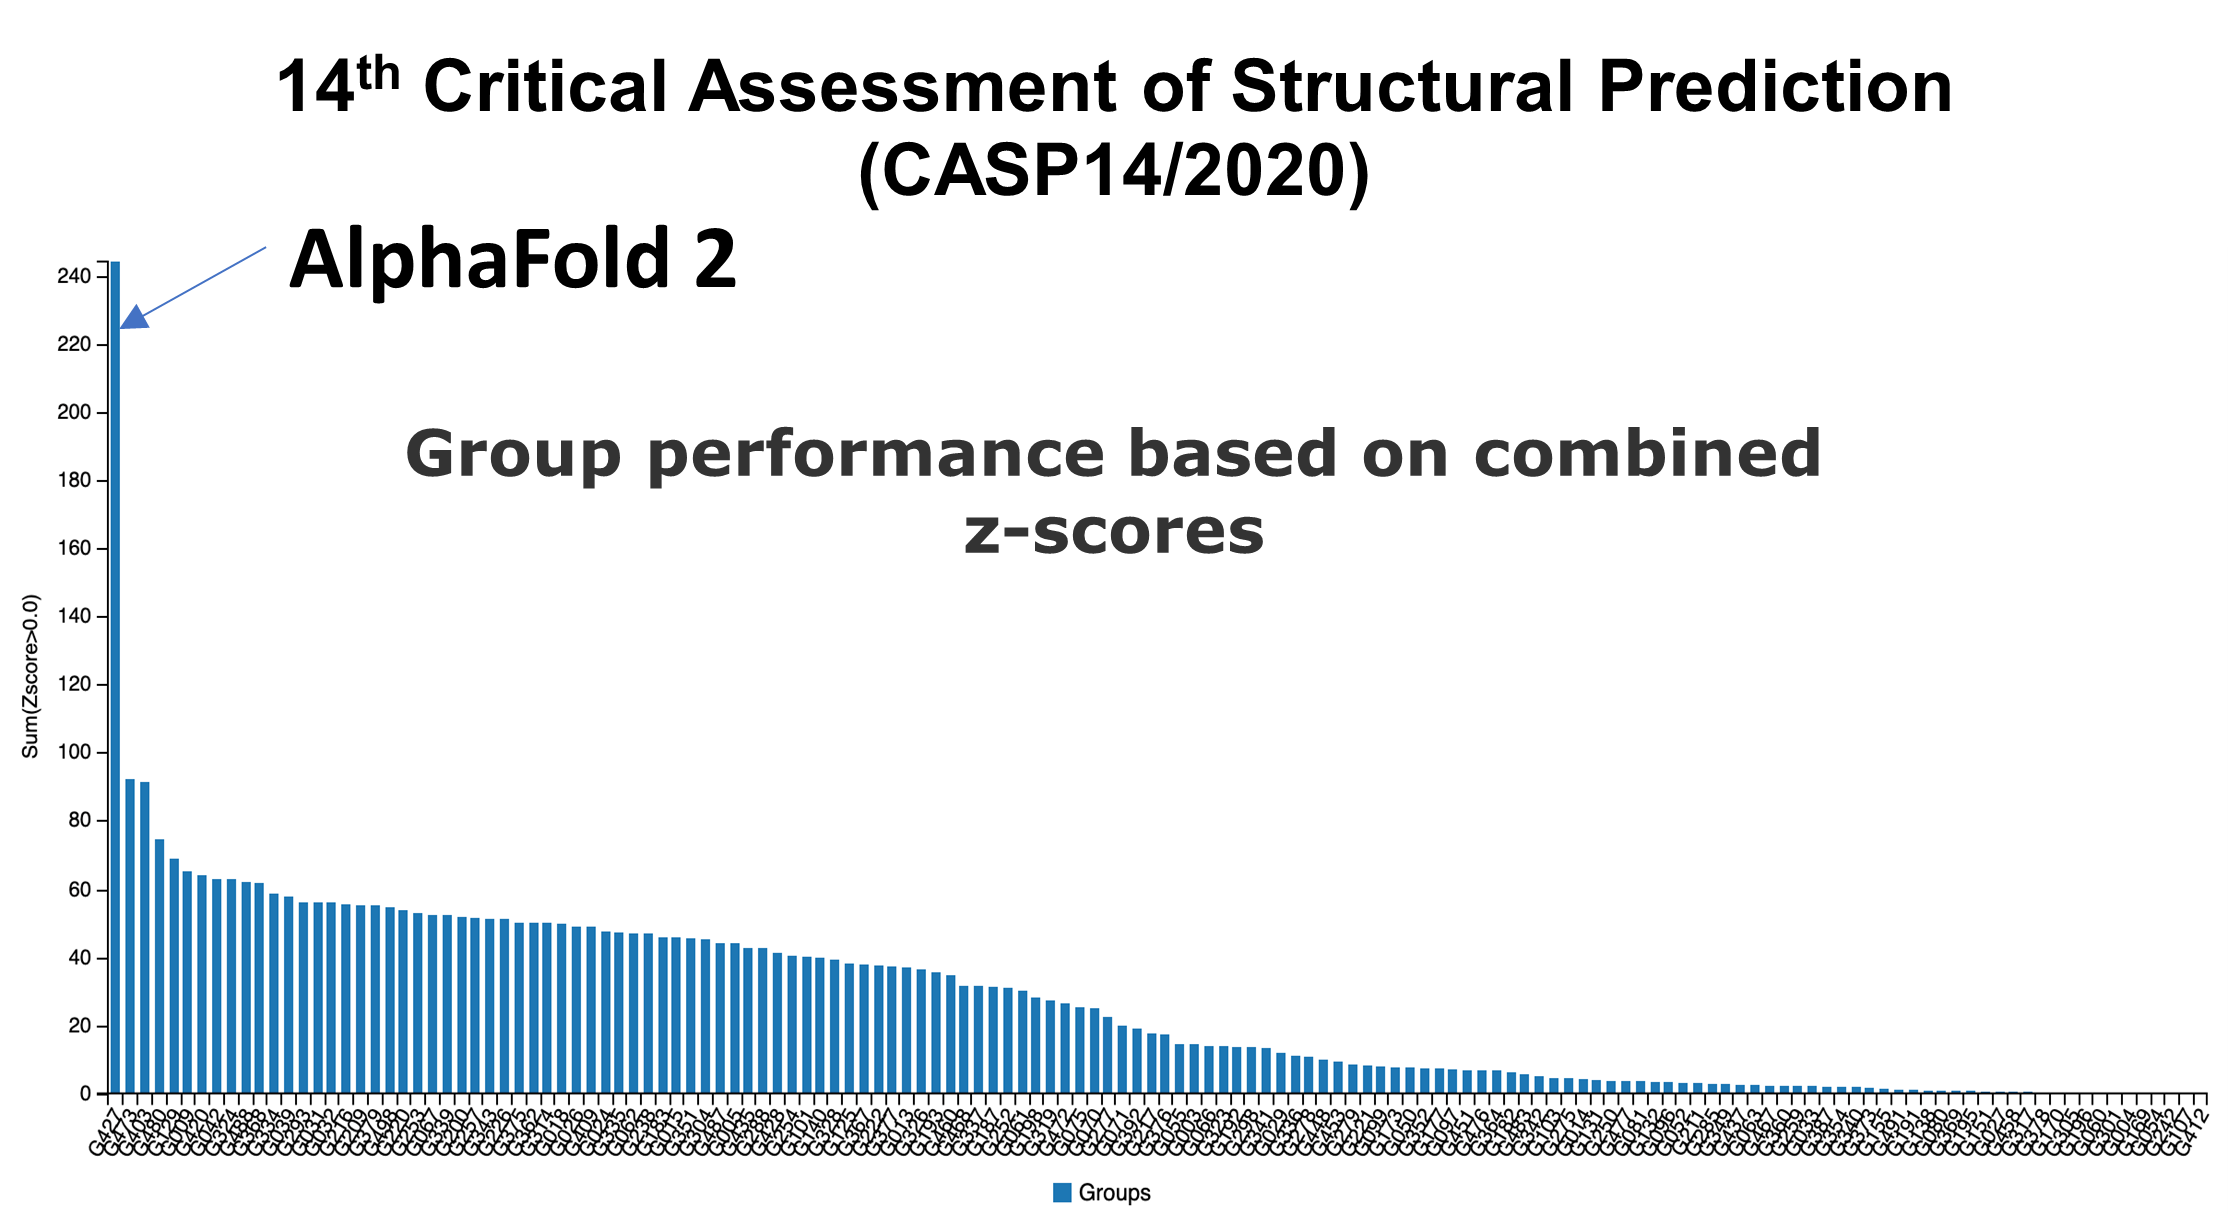
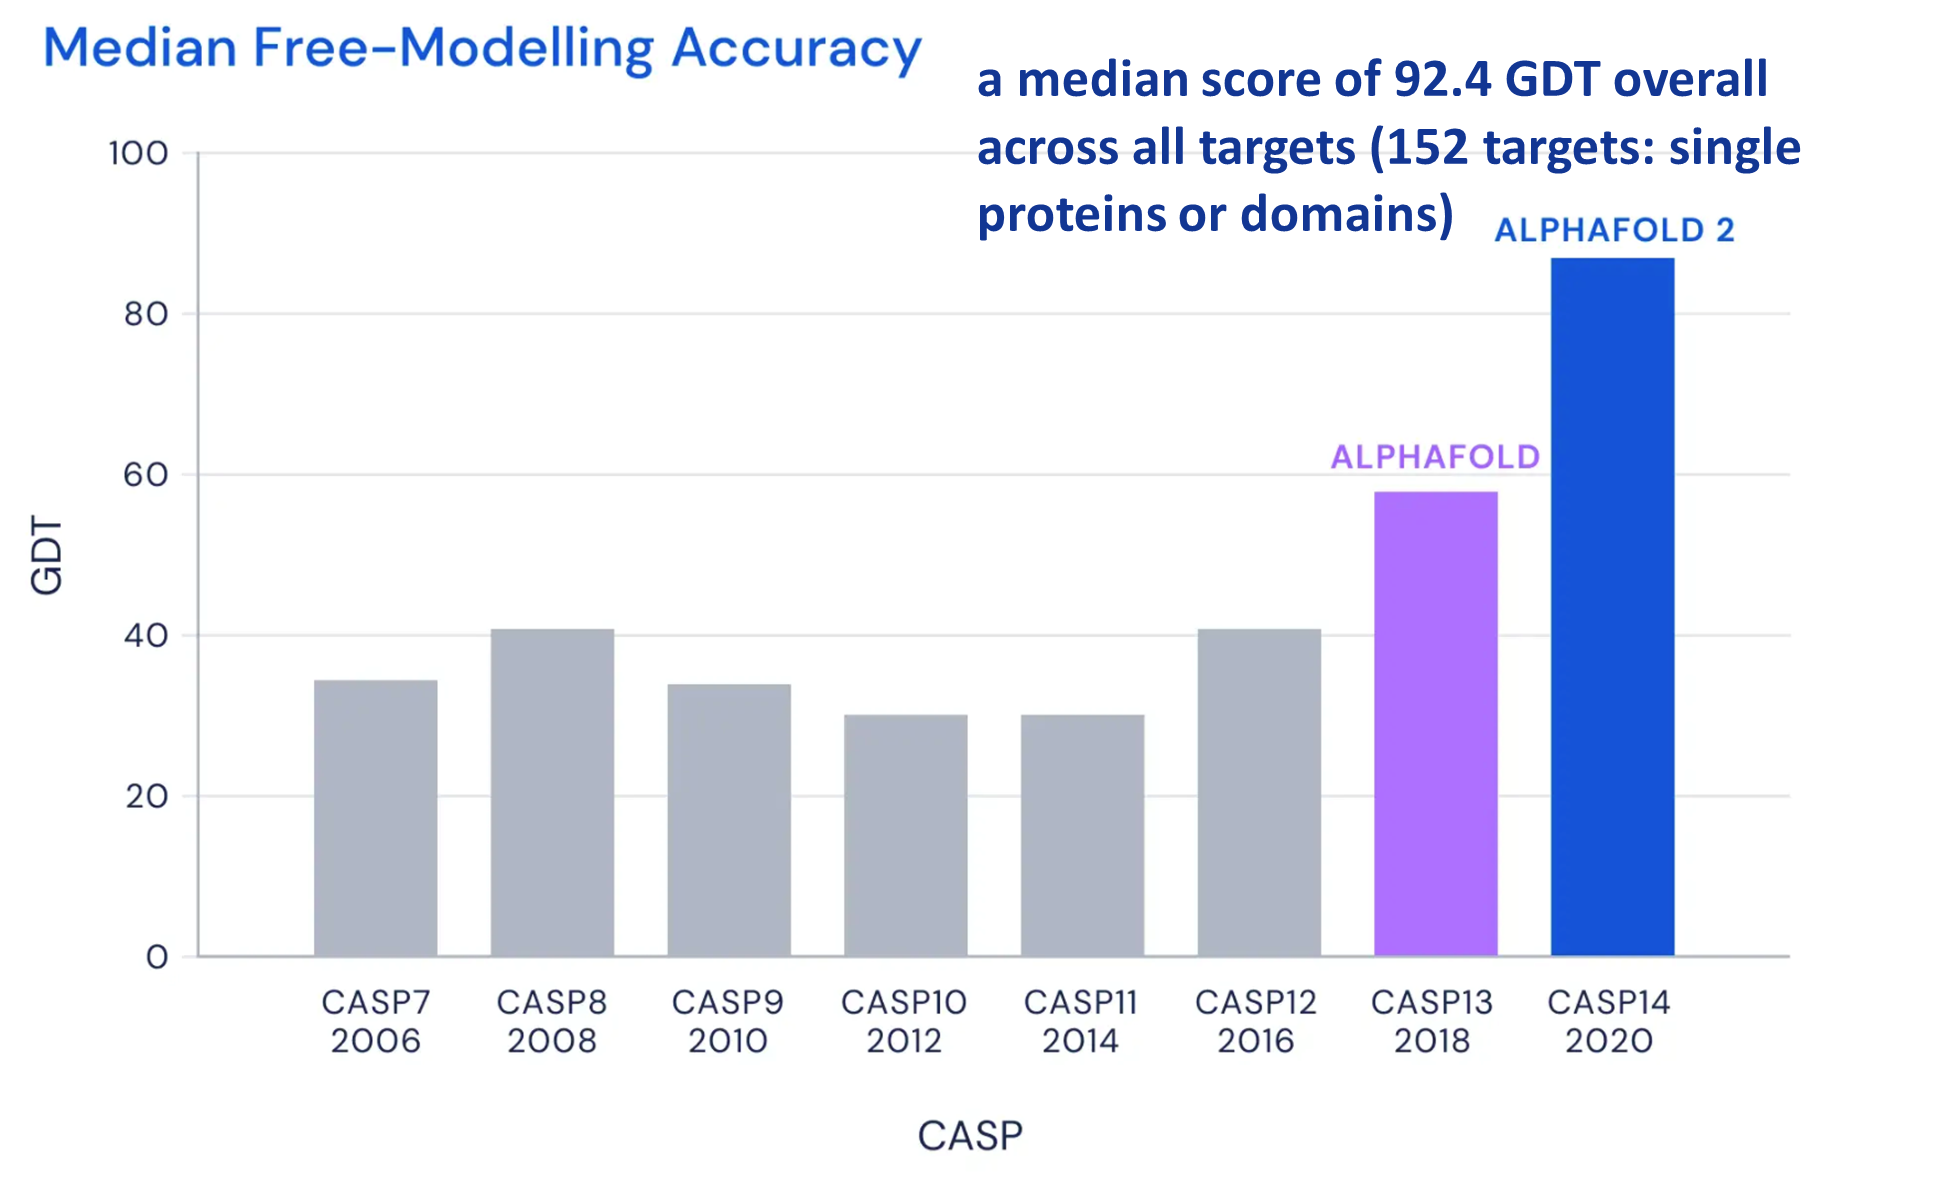
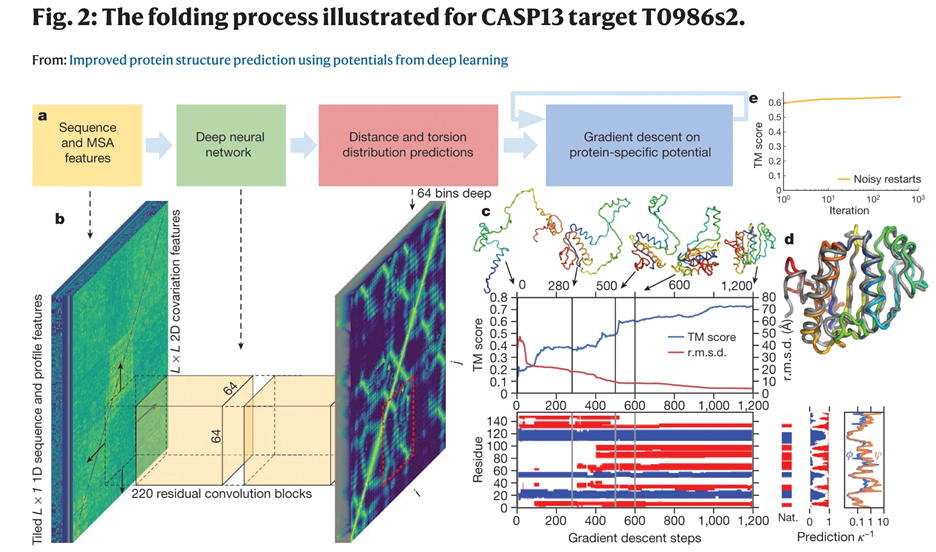
The subject of machine learning has been discussed in a previous post about Protein folding prediction. Briefly, it is helpful to remember that machine learning is a process to create algorithms that give an outcome based on training data. The more diverse, large, and well curated the data, the better the accuracy of the program. One pitfall is they are based on previous data, which works well for many situations: using AI to find a lung cancer on chest x-ray would work well, because lung cancers have consistent characteristics.

However, with COVID-19, new variants keep arising and current variants are evolving (think Delta and Delta “plus”). Furthermore, if the classifier Pangolin is trained on high quality data, then trying to interpret lower quality data (missing genome regions, few sequencing reads) may confuse Pangolin and lead to inaccurate results. What follows is an example of how this occurred at our institution.

Case study

We have been sequencing COVID-19 positive specimens at UT Southwestern for the last several months. Many of the cases have been the Alpha variant (B.1.1.7, origin U.K.). However, it was around this time that Delta (B.1.617.2, origin India) cases started to arise. In one week, we found two specimens that were classified as B.1.95. This was an unusual variant I had not heard of before. There are several “wild type” strains that are B.1.1/ B.1.2 and other derivations, but I had not seen anything like this before.

Clinical history

Two specimens sequenced belonging to Hispanic, adolescent brothers whose mother had recently been hospitalized with COVID-19. There was information on mother’s travel history.

Therefore, I performed manual review of the specific variants. Many of the diverse mutations occur in the spike protein, so this was analyzed first. Immediately, I noticed two classic mutations of the Delta variant: a 2 amino acid deletion in the spike gene (S:Del157_158) and a receptor binding site mutation (S:L452R) also seen in the variant from California (B.1.429). Other mutations could be evaluated, but the combination of these two mutations is unique to Delta variant.

One suspected cause was that the Pangolin lineage classifier had an issue. Specifically, it had not been updated since February 2021- when Delta did not exist. Thus, there was no data for the program to classify the variant properly. Upgrading to the latest version of Pangolin provided the correct lineage classification.

A Few weeks later…

Once again, I was checking the lineages reported by the classifier and there were several B.1.617.2 and B.1.617.1. Both of these are variants from India (before the helpful WHO Delta designation), but they are distinct sub-variants. It was odd to see B.1.617.1, because this was found to be less infectious compared to the dominant B.1.617.2 variant (later named Delta) and B.1.617.1 was not spreading across the globe.

Intervention:

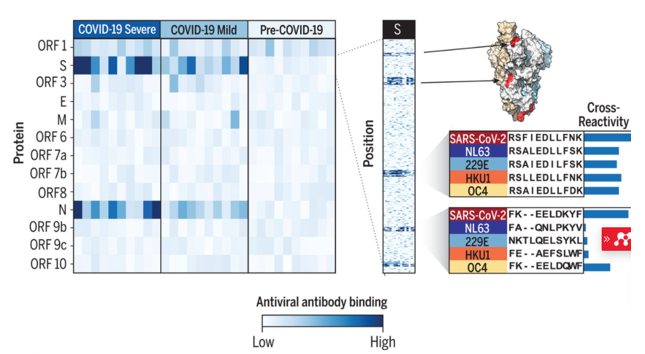
Therefore, I once again went to the sequence data for the spike protein to compare some mutations. Although these are sub-variants from the same original variant, they have several mutually exclusive mutations in the spike protein. The figure below compares the prevalence of specific mutations in the spike protein of B.1.617.1 and B.1.617.2 (dark purple = common in a variant, white = rare).

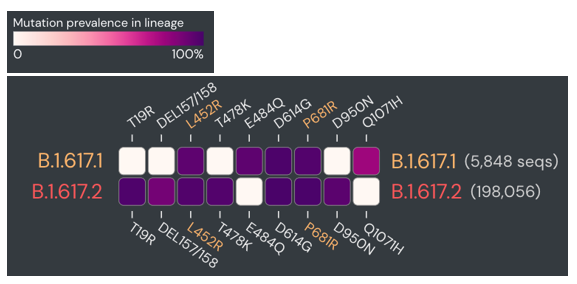
Upon manual review, all of the spike gene mutations were specific to B.1.617.2. So why was there an issue in classification? Again, there were few sequences for either of these sub-variants at that time, so the classifier wasn’t as well trained. Updating the Pangolin version brought the benefit of new data and more accurate classifications.

Take away messages

  1. Updating Lineage classification software (Pangolin) on a regular basis is needed for accurate results.
  2. Manual review is essential for any abnormal findings- a typical process for pathologists, but also plays an important role in COVID-19 variant monitoring.
  3. Know what you’re looking for and know which mutations differentiate the variants.
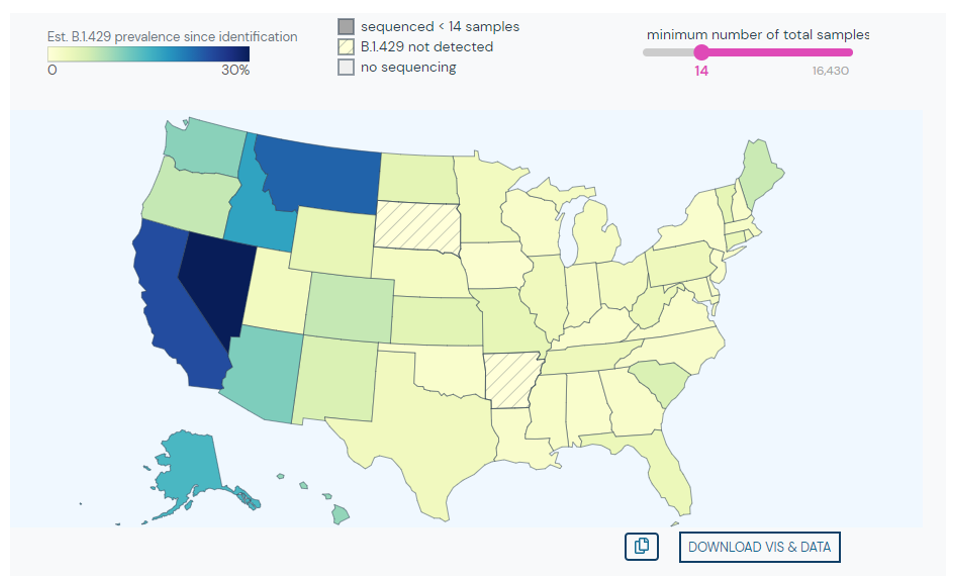
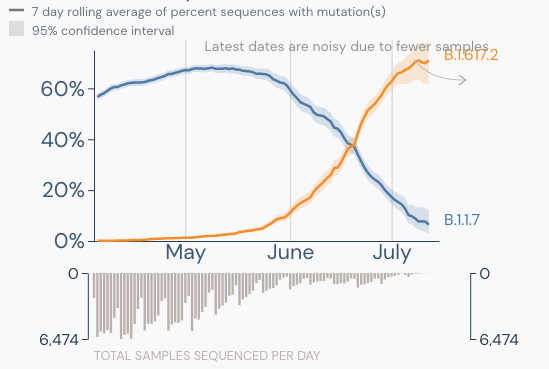
  4. Delta is now the dominant strain in the U.S. (graphic below).

References

  1. Outbreak.info
  2. https://pangolin.cog-uk.io/

Jeff SoRelle, MD is Assistant Instructor of Pathology at the University of Texas Southwestern Medical Center in Dallas, TX working in the Next Generation Sequencing lab. His clinical research interests include understanding how lab medicine impacts transgender healthcare and improving genetic variant interpretation. Follow him on Twitter @Jeff_SoRelle.

How to Detect COVID-19 Variants of Concern

It’s a little deja-vu writing this title one year after a similar blog post on how to validate a COVID-19 assay at the start of the pandemic. In many ways, the challenges are similar: limited reagents/control material, and rising case counts. At least now, there is increasing support in the way of funding from the federal government that could help with monitoring and surveillance. I’m going to summarize the current methods available for detecting the Variants of Concern and emerging variants.

Whole Genome Sequencing

The principle method used by many is whole genome sequencing. It has the advantage of being able to comprehensively examine every letter (nucleotide) of the SARS-CoV-2 genome (30 kilobases long). At our institution, I’ve been working on the effort to sequence all of our positive specimens. While it is achievable, it is not simple nor feasible at most locations. Limitations include:

  • Financial: must already own expensive sequencers
  • Expertise: advanced molecular diagnostics personnel needed who perform NGS testing
  • Data Analytics: bioinformatics personnel needed to create pipelines, analyze data and report it in a digestible format.
  • Timing: the process usually takes a week at best and several weeks if there is a backlog or not enough samples for a sequencing run to be financially viable.
  • Sensitivity: the limit of detection for NGS is 30 CT cycles, which for us includes only about 1/2- 1/3 of all positive COVID19 specimens.

 Bottom line: WGS is the best at detecting new/ emerging strains or mutations when cost/ time is not a concern.

Mutation Screening

Other institutions have begun efforts to screen for variants of concern by detecting characteristic mutations. For instance, the N501Y mutation in the spike protein is common to the major Variants of Concern (UK B.1.1.7, Brazil P.1, and S Africa B.1.351) and E484K is present in the Brazil (P.1), S Africa (B.1.351) and New York Variant (B.1.526). Thus, several institutions (listed below) took approaches to 1) screen for these mutations and then 2) perform WGS sequentially.

InstitutionMethodTargets
Hackensack Meridian Health (HMH)Molecular Beacon Probes, melting tempN501Y, E484K molecular beacons
Rutgers, New JerseyMolecular Beacon Probes, melting tempN501Y molecular beacons
VancouverProbe + melting curve (VirSNiP SARS-CoV-2 Mutation Assays)N501Y screen + qPCR reflex; Probe, melt curve assay
YaleRT-qPCR probe assayS:144del, ORF1Adel
ColumbiaRT-qPCR probe-assayN501Y, E484K

As you can see, HMH, Rutgers and Vancouver are using assays that use probes specific to characteristic alleles combined with melting temperature curves to detect a mutation induced change. Melting curve analysis is normally performed after qPCR to ensure that a single, correct PCR product is formed. This measure is calculated based on the change in fluorescence that occurs when the fluorescent marker is able to bind to its target DNA. Thus the Tm (melting temperature) is similar to the annealing temperature. In this case where a mutation is present in the probe (DNA fragment) binding site, binding is disrupted and occurs at lower a temperature as seen by the downward shift of 5 degrees Celsius in the graph below.

Figure 1. Schematic showing the melting temperature shift for the HMH designed probe binding normal and mutant (E484K variant) sequences at decreasing concentrations.
Figure 2. Similar shift downward in melting temperature for the Rutgers assay when a wild type probe encounters a mutant vs. WT sequence.

These approaches are quick, but can only perform a 2-3 reactions per well and require much of the same expenses as diagnostic RT-qPCR assays. Most of the studies describe this method as a way of screening for samples to be NGS sequenced, however they will not be as good at detecting emerging strains. For example, the N501Y mutation is not present in the New York nor California variants.

Multiplex RT-qPCR can solve some of these problems. At Columbia and Yale, multiple targets are designed to detect B.1.1.7 (N501Y only at Columbia and S144del + ORF1A del at Yale) vs. Brazil/ S. Africa variants (N501Y & E484K at Columbia and ORF1A only at Yale). As new variants have arrived, we found the New York strain carrying both ORF1A deletion and the E484K mutation. It is now clear there are some hotspot areas for mutation within the SARS-CoV-2 genome, which can complicate interpretations. Therefore, these RT-PCR assays are still useful for screening, but do not replace the need for Whole Genome Sequencing.

Genotyping

Given the overlapping spectrum of mutations, it would be helpful to test several markers all at once in a single reaction. At a certain point, this would effectively “genotype” a variant as well as WGS. The assays above have been limited to 2 targets/ reaction due to limited light detection channels. Therefore, I’ve created a multiplex assay that can be scaled up to include 30-40 targets within a single reaction without the need for expensive probes. This method is multiplex PCR fragment analysis, which is traditionally used for forensic fingerprinting or bone marrow transplant tracking. In this method, DNA of different length is amplified by PCR, then separated by capillary electrophoresis-the same instrument that performs Sanger Sequencing.

Fragment analysis can be performed to detect deletion/ insertion mutations and single nucleotide polymorphisms (SNPs) by allele-specific primers or with restriction enzymes that only cut the WT or Mutant sequence.

I designed the assay to target 3 deletion mutations in B.1.1.7: S:D69_70, S: D144, and ORF1A: D3675_3677. Each deletion has a specific length and if 3/3 mutations are present, then there is 95% specificity for the B.1.1.7 strain. Samples from December to present were tested and in the first batch, I detected the characteristic B.1.1.7 pattern (expected pattern and observed pattern below).

Theoretical picture of what the fragment analysis assay would look like for B.1.1.7. An actual patient sample results below, which showed the expected deletions exactly as predicted:

We have tested and sequenced over 500 positive specimens, and we found increasing levels of the B.1.1.7 strain prevalence up to nearly 30% by the middle of March. All screened B.1.1.7 specimens were validated by WGS. These results and the ability to detect the New York and California variants are detailed in our recent pre-print.

Weekly prevalence of isolates consistent with B.1.1.7 in North Texas.

Implications for future Variant Surveillance

As B.1.1.7 has become the dominant strain, and sequencing efforts are increasing. I would argue that assays should be used for what they are best at. For instance, it could be considered a waste of NGS time and resources to sequence all Variants when >50% are going to be B.1.1.7 if other tests can verify the strain faster for 10-20% of the cost. Instead, I think WGS should be focused on discovering emerging variants for which it is best suited. Across the US, case numbers have been decreasing and the number of specimens testable could be expanded by using a more sensitive PCR assay that could.

References

  1. Clark AE et al. Multiplex Fragment Analysis Identifies SARS-CoV-2 Variants. https://www.medrxiv.org/content/10.1101/2021.04.15.21253747v1
  2. Zhao Y et al. A Novel Diagnostic Test to Screen SARS-CoV-2 Variants Containing E484K and N501Y Mutations. A Novel Diagnostic Test to Screen SARS-CoV-2 Variants Containing E484K and N501Y Mutations | medRxiv
  3. Banada P et al. A Simple RT-PCR Melting temperature Assay to Rapidly Screen for Widely Circulating SARS-CoV-2 Variants. A Simple RT-PCR Melting temperature Assay to Rapidly Screen for Widely Circulating SARS-CoV-2 Variants | medRxiv
  4. Annavajhala MK et al. A Novel SARS-CoV-2 Variant of Concern, B.1.526, Identified in New York. A Novel SARS-CoV-2 Variant of Concern, B.1.526, Identified in New York | medRxiv
  5. Matic N et al. Rapid detection of SARS-CoV-2 variants of concern identifying a cluster of B.1.1.28/P.1 variant in British Columbia, Canada. Rapid detection of SARS-CoV-2 variants of concern identifying a cluster of B.1.1.28/P.1 variant in British Columbia, Canada | medRxiv
  6. Vogels CBF et al. PCR assay to enhance global surveillance for SARS-CoV-2 variants of concern. PCR assay to enhance global surveillance for SARS-CoV-2 variants of concern | medRxiv

Jeff SoRelle, MD is Assistant Instructor of Pathology at the University of Texas Southwestern Medical Center in Dallas, TX working in the Next Generation Sequencing lab. His clinical research interests include understanding how lab medicine impacts transgender healthcare and improving genetic variant interpretation. Follow him on Twitter @Jeff_SoRelle.

COVID Variants

Since my last post on the B.1.1.7 (UK) variant, several other variants have arisen. I wanted to describe what makes some Variants of Interest and other Variants of Concern. While a “variant” is often synonymous with a mutation in genetic terms, in the context of SARS-CoV-2, variant means an alternative strain of the virus.

To become a Variant of Interest (VOI), the World Health Organization (WHO) or Centers for Disease Control (CDC) has the following characteristics:

  • Evidence of variants that affect transmission, resistance to vaccines/ therapeutics, mortality, or diagnostic tests
  • Evidence that the variants is contributing to a rise in the proportion of cases in an area.
  • However, limited geographical spread.

Examples: P.2 (from Brazil) B.1.525 (New York), and B.1.526 (New York).

Variants of Concern have increased problems with the same characteristics listed above:

  • Evidence of reduced vaccine protection from severe disease
  • Evidence of substantially reduced response to neutralizing antibodies or therapeutics
  • Evidence of widespread spread
  • Increased Transmissibility or disease severity

Current VOCs: B.1.1.7 (UK), B.1.351 (South Africa), P.1 (Brazil), and B.1.427/ B.1.429 (California).

The initial VOC of B.1.1.7, B.1.351 and P.1 were identified from having increased spread and more mutations than expected, especially in the Spike gene region (Figure 1).

The N501Y mutation in the Spike protein is present in each VOC. It is located at the tip of the protein that binds the ACE2 receptor, increasing binding strength.

So far, vaccines react against the B.1.1.7 variant. However, B.1.351 pseudovirus shows decreased neutralization by both Moderna and Pfizer sera. Specifically, the E484K mutation in the Spike protein confers resistance to neutralizing antibodies. Thus, the strains B.1.351 and P.1 are more likely to be resistant as would any other strain with the E484K variant.

Lastly, the California variant arose as it was found to rise in prevalence from November to February. The key mutations include W152C and L452R, but the significance of this variant is uncertain. However, this variant has begun to spread over much of Southern California and Nevada.

References

  1. Wu K, Werner AP, Moliva JI, Koch M, Choi A, Stewart-Jones GBE, Bennett H, Boyoglu-Barnum S, Shi W, Graham BS, Carfi A, Corbett KS, Seder RA, Edwards DK. mRNA-1273 vaccine induces neutralizing antibodies against spike mutants from global SARS-CoV-2 variants. bioRxiv [Preprint]. 2021 Jan 25:2021.01.25.427948. doi: 10.1101/2021.01.25.427948. PMID: 33501442; PMCID: PMC7836112.
  2. Tada T, Dcosta BM, Samanovic-Golden M, et al. Neutralization of viruses with European, South African, and United States SARS-CoV-2 variant spike proteins by convalescent sera and BNT162b2 mRNA vaccine-elicited antibodies. Preprint. bioRxiv. 2021;2021.02.05.430003. Published 2021 Feb 7. doi:10.1101/2021.02.05.430003
  3. Gangavarapu, Karthik; Alkuzweny, Manar; Cano, Marco; Haag, Emily; Latif, Alaa Abdel; Mullen, Julia L.; Rush, Benjamin; Tsueng, Ginger; Zhou, Jerry; Andersen, Kristian G.; Wu, Chunlei; Su, Andrew I.; Hughes, Laura D. outbreak.info. Available online: https://outbreak.info/ (2020)
  4. https://www.cdc.gov/coronavirus/2019-ncov/cases-updates/variant-surveillance/variant-info.html

Jeff SoRelle, MD is Assistant Instructor of Pathology at the University of Texas Southwestern Medical Center in Dallas, TX working in the Next Generation Sequencing lab. His clinical research interests include understanding how lab medicine impacts transgender healthcare and improving genetic variant interpretation. Follow him on Twitter @Jeff_SoRelle.

AI vs. Crystallography: Predicting Pathogenic Variants?

Some very exciting news was recently announced about Artificial Intelligence impacting protein structure prediction. But like many of us, you probably thought, “Oh that’s nice.” Followed by either, “But that’s unlikely to impact lab medicine” or “I have no idea how they did that.”  Today I will help turn around those last two thoughts for you!

The big news was that a U.K. company specializing in artificial intelligence, DeepMind (owned by Google-of course), won the CASP14 competition. CASP14 is the 14th edition of the biannual bake-off competition where teams use bioinformatic approaches to predict protein structures. The organizers then judge how well predictions match experimentally derived structures using a score called: GDT. This score reflects the distance of where something is vs. where it should be. Each of the ~150 protein sequences are scored on this basis and given a final percent identity score (0-100%).

Figure 1. The Z-score is just the difference of a sample’s value with respect to the population mean, divided by the standard deviation. The groups that are markedly better than the average will have larger Z-scores.

Since the competition started in 1997, the winners have scored ~50% on average. That is until 2 years ago when AlphaFold, the AI created by DeepMind, won with a top score of 55%. Their paper was published open access (Ref: https://www.nature.com/articles/s41586-019-1923-7) and used similar techniques applied by others where proteins were progressively folded by a computer until the lowest energy state is revealed.

Figure 2. Improvements in the media accuracy of predictions in the free modelling category for the best team in each CASP. Measured as best-of-5 GDT.
GDT: Global Distance Test (0-100); the percentage of amino acid residues within a threshold distance from the correct position. GDT of around 90 is considered competitive with results obtained from experimental methods.

The programs driving this folding may consider amino acid charge, size, and polarity, genetic conservation (Ref), or similarity to other protein domains. However, the innovation here was that DeepMind used artificial intelligence to examine sequence information with a convolutional neural network to identify structural constraints that are used to predict accurate protein folding.


Figure 3. Sequence of events from Dataà Deep neural network (Artificial intelligence)àPredictions à protein folding process. (Figure 2 of this reference: https://www.nature.com/articles/s41586-019-1923-7/figures/2).

This results in one of those famous algorithms you’ve heard about. However, these algorithms are more complex than a simple linear regression and it is nearly impossible to trace how exactly how different levels of importance were assigned to each variable. An important requirement for an accurate A.I. derived algorithm is that it has a large training data set. Fortunately for Deepmind, they were able to train AlphaFold using about 170,000 structures that were determined experimentally using x-ray crystallography, nuclear magnetic resonance spectroscopy, and electron microscopy.

Although we haven’t seen what was changed between AlphaFold and AlphaFold 2, we have learned that AlphaFold 2 vastly outperformed the original in CASP14 with 91% accuracy. When programs are >90% accurate they are considered to be essentially as good as experimentally derived structures. In fact, AlphaFold 2 was able to provide more information than the experiments!  One researcher found that their experimentally derived structure had a different configuration than the one predicted by AlphaFold, so they assumed the prediction by AlphaFold 2 was incorrect. After further analysis, the experimentally derived structure was found to be very similar to the structure predicted by AlphaFold 2. In another case, AlphaFold 2 predicted that an amino acid was in an infrequently found conformation, so they figured AlphaFold 2 made a mistake. After reanalyzing the experimental data, they found that that AlphaFold 2 was correct. It was even suspected that several lower-scoring structures based on NMR data may reflect lower accuracy in the experimental structure instead of a problem with the algorithm.

Figure 4. (Left) Model for the T1064 target (red) superimporsed onto the structure from DeepMind in CASP14 (blue). (Right) Black and green structures are from the runner-ups who made predictions for the same structure (correct in blue). Obtained from CASP14 webpage on Tuesday December 1st, 2020.

Will AI replace experimental crystallography? To answer this question, I turned to a colleague in my basic science lab, Lijing Su, who has been a structural biologist for many years. Like many cases of AI, this is a useful tool, but it doesn’t entirely replace her work because a lot of the structural biology research focuses on how proteins move and change as they do their job. Structural biology has moved beyond structures of single proteins and is now focused on how different proteins interact. There is still a role for crystallographers as AlphaFold cannot perform this role…yet.

All this still begs the question of a laboratorian “Who needs to know protein structure anyways?” We understand that knowing protein structures can help explain function, which has implications with drug development. However, our main role is to provide tests that diagnose disease. A major challenge in molecular pathology is to predict whether a genetic variant causes loss of protein function. Current software has poor performance (PolyPhen2 sensitivity= 45% specificity= 50%) as they mainly measure changes in chemical properties and amino acid site conservation. One potential application of AlphaFold is to examine the effect of genetic variants on protein structure. Pathogenic changes would be predicted to deform portions of the structure impairing activity or provoking degradation through the unfolded protein response.

As the current speed of the program is quite long, this could be difficult to implement immediately, but it is imaginable that this will become quicker. A straightforward way to validate this AI software would use confirmed pathogenic or benign variants from the public database ClinVar. There are over 1,000,000 entries into this database, which would provide a useful training and validation set. It is likely that change in protein structure would be a stronger mechanism of disease for certain types of proteins (ion channels for epilepsy or myosin chains for muscular disorders) and a less strong predictor of pathogenicity for other types of proteins (enzymes for metabolic disorders or signaling proteins where protein-protein interaction is important for function).

This blog entry was written with the very helpful insights and knowledge of Lijing Su, PhD.

References

  1. Senior AW et al. Improved protein structure prediction using potentials from deep learning. Nature. 2020; 577: 706–710.
  2. CASP14 website: https://predictioncenter.org/casp14/
  3. Arnold CN et al. ENU-induced phenovariance in mice: inferences from 587 mutations. BMC Res Notes. 2012; 5: 577.
  4. https://deepmind.com/blog/article/alphafold-a-solution-to-a-50-year-old-grand-challenge-in-biology

-Lijing Su is Assistant Professor in the Center for Genetics of Host Defense at the University of Southwestern Medical Center. She specializes in structural biology and helps determine multi-protein interactions to explain unknown mechanisms of genes important to immunology.

Jeff SoRelle, MD is Assistant Instructor of Pathology at the University of Texas Southwestern Medical Center in Dallas, TX working in the Next Generation Sequencing lab. His clinical research interests include understanding how lab medicine impacts transgender healthcare and improving genetic variant interpretation. Follow him on Twitter @Jeff_SoRelle.

Stable Chimerism Post-Double Cord Transplant

Hello again! The last case study was an example of a patient with a loss of allele at two STR loci on a shared chromosome. Today, I wanted to share an interesting and unusual case that we monitor in our lab. This case explores the use of cord bloods as the source of the donor, and in this case, a double cord blood transplant.

Cord blood (CB) unit transplants can be advantageous over other donor sources, such as bone marrow or peripheral blood. The Leukemia and Lymphoma Society summarizes these advantages well, with some being their availability (CB can be prescreened/tested and then frozen for use when needed – decreasing the risk of disease transmission), less-strict HLA matching requirements, decreased graft versus host disease (GVHD) occurrence and severity, long-term storage (CB over 10 years old has been successfully transplanted), increased diversity of donors, and reduced risk of disease relapse, to name a few.2, 3

CB also has its disadvantages, some include: less stem cells for engraftment which leads to longer engraftment times, these longer engraftment times lead to longer immunological recovery and a higher risk of infection, less available clinical data relative to stem cell and bone marrow transplants (newer procedure comparatively in transplant), and no additional cells for infusions later on in treatment. Further, selecting the best cords for transplant can be challenging due to the static variables of a CB (again, there is no donor to go back and get more cells). Considering all that CB has to offer, haplo-identical transplants are preferred in the U.S. over CB transplants. 2,3,4

Before the University of Minnesota pioneered the strategy of double cord transplants, single cord transplants gave rise to a high incidence of graft failure and transplant related mortality. 2 Double cord transplants have now become standard when utilizing CB as the donor, as a single CB unit contains a small number of required and necessary cells for a successful transplant and double units help overcome the issues that this presents.

Double cord transplants are interesting and complicated for analysis purposes (and in general!). All stem cell transplants involve a dynamic process between the cells of the donor and recipient. Yet, double cords bring in another dynamic process including an additional donor.1,2 Through the chimerism monitoring process, the complexity of the engraftment process can be appreciated as one cord ultimately becomes the “winner” and the other the “loser”. In other words, one engrafts and is detectable, while the other cord fails to engraft and becomes undetectable. Figure 1 demonstrates this process, where both cords are present initially after transplant. Then, at 43 days post-transplant, a single donor cord (D2) engrafts while the other donor cord (D1) does not engraft. D1 is most likely eliminated from the host, potentially explained by multiple theories, and no longer is detectable by chimerism testing.

Figure 1. “D1” (blue) and “D2” (pink) represent donor cord one and two alleles, respectively. “D2R” (green) represent a shared allele among donor cord two and the recipient. Each image is a time lapse of the “D18S51” STR locus post-transplant. Alleles 12, 14, 15, and 19 are present at this locus. At 21 days post-transplant, both donors are present. At 43 days post-transplant and following, only donor 2 is present and alleles 14 and 15 are no longer observed.

In the case study below, the patient was diagnosed with chronic myeloid leukemia and received a double cord transplant in 2014. One would expect, as described above, that one cord would become the “winner” while the other is rejected and becomes the “loser” and becomes undetectable. Interesting enough, this patient never achieved a status of a “winner” or “loser” cord. Rather, both remained persistent within the patient’s chimerism profile and over time have become relatively stable in their percentages.

In the electropherogram below (Figure 2), alleles from both donors can be appreciated from the CD3 (top) and CD33 (bottom) lineages. Each lineage exhibits different constitutions of the donor cord percentages, where CD3 has a greater proportion of cord two than CD33; yet both lineages have a greater overall percentage of cord two than cord one. Looking at the line graph (Figure 3), the differences between the cord percentages can be further appreciated over time. It can even be noted that the cord proportions in the CD33 lineage swapped in 2017, only to swap back to favor cord two and to remain that way since. Changes of donor-recipient relative percentages occur throughout the post-transplant journey and these events are due to complex processes. Some patients become transient mixed chimerisms (who initially are mixed chimerism but later achieve total/complete chimerism), others achieve complete chimerism, and yet others may become stable mixed chimerism. It is important to note that, even in cases where complete chimerism is not achieved, disease remission can still be present.1 In this case, the patient has achieved a stable mixed chimerism status among both donor cords and, to our lab’s knowledge, is doing well clinically.

Figure 2. “D1” (blue) and “D2” (pink) represent donor cord one and two alleles, respectively. Green D1D2R, D2R, and D1D2 represent shared alleles (where “R” represents recipient alleles). Comparing the top (CD3) and bottom (CD33) electropherograms, it can be appreciated that the percentage of each cord is different for each lineage population.
Figure 3. The red line graph on the left depicts the donor percentage of each cord blood unit (CBU) of CD3 lineage over time (11/2016 – 07/2020). It can be appreciated that CBU 2 is the dominant cord for CD3. The blue line graph on the left depicts the donor percentage of each CBU of CD33 lineage over time (11/2016 – 07/2020). It can be appreciated that CBU 2 is also dominant, but the differences between the cord donor percentages are much less compared to that of the CD3 lineage. Also, you can see over time that the two cords are relatively stabilizing in the percentages.

This case brings me back to a memory of my professor, who spoke briefly of this occurrence in a lecture only to quickly admit of its rarity. This is an interesting case because it represents one of those extremely uncommon instances. It is a privilege to be a part of a transplant center, like Northwestern’s, where we can witness rare and unique presentations like this. It opens up opportunities to learn and explore the complexities that transplant medicine and molecular HLA have to offer.

References

  1. Faraci M, Bagnasco F, Leoni M, et al. Evaluation of Chimerism Dynamics after Allogeneic Hematopoietic Stem Cell Transplantation in Children with Nonmalignant Diseases. Biol Blood Marrow Transplant. 2018;24(5):1088-1093. doi:10.1016/j.bbmt.2017.12.801
  2. Gutman JA, Riddell SR, McGoldrick S, Delaney C. Double unit cord blood transplantation: Who wins-and why do we care?. Chimerism. 2010;1(1):21-22. doi:10.4161/chim.1.1.12141
  3. Leukemia & Lymphoma Society. Transplantation Facts.https://www.lls.org/sites/default/files/file_assets/FS2_Cord_Blood_Transplantation_6_16FINAL.pdf. Published May 2016. Accessed December 15, 2020.
  4. Gupta AO, Wagner JE. Umbilical Cord Blood Transplants: Current Status and Evolving Therapies. Front Pediatr. 2020;8:570282. Published 2020 Oct 2. doi:10.3389/fped.2020.570282

-Ben Dahlstrom is a recent graduate of the NorthShore University HealthSystem MLS program. He currently works as a molecular technologist for Northwestern University in their transplant lab, performing HLA typing on bone marrow and solid organ transplants. His interests include microbiology, molecular, immunology, and blood bank.

Will the B.1.1.7 variant evade the Vaccine/Tests?

Will the B.1.1.7 variant evade the vaccine/tests?

This question came up recently and I wanted to share some cutting edge information the addresses this. This was in part adapted from Akiko Iwasaki’s (Yale HHMI immunologist) Twitter discussion of this subject.1

Will B.1.1.7 evade our tests?

The UK variant commonly called lineage B.1.1.7 (officially Variant of Concern 202012/01) has 23 genetic variants that result in 17 protein coding changes.2 Most tests including the ones at our institution (Abbott) are not currently affected (see below). Only the ThermoFisher assay has declared a target that covers the 69-70del variant in the S gene (in green). This conversely makes the TaqPath® assay one way to detect a potential B.1.1.7 variant.

Figure 1. A picture of the SARS-CoV-2 genome with red lines indicating mutation sites and different assays and relative location of their qPCR targets.

Will the vaccine protect against the B.1.1.7 variant?

The Pfizer and Moderna RNA vaccines create an immune response against the spike protein. We don’t know the exact sequences or reactivity of the vaccines’ spike protein. However, a recent study looked at the antibody reactivity to linear epitopes of COVID-19 in 579 patients who were naturally infected with COVID-19. For the antibodies against the spike, the major reactive linear epitopes are indicated in Red at the bottom. None of the B.1.1.7 mutations (Orange) overlap with these major reactive epitopes.3 

Figure taken from Reference 3.

For a closer look, see below.

Figure taken from Reference 3.

A limitation of these analyses is the use of only linear epitopes. Mutations might impact a 3D epitope affecting Ab binding. However, people make multiple antibodies to the spike protein.4 So, broad coverage should arise after exposure to the either the vaccine or natural infection with COVID-19.

The vaccine should induce a polyclonal antibody response that recognizes multiple parts of the spike protein, making it effective, even against novel variants. Also, there should be few to no False Negative COVID-19 tests due to the new variant, but we will continue to monitor and test this experimentally. 

References

  1. Prof. Akiko Iwasaki @VirusesImmunity
  2.  Chand, Meera et al. Investigation of novel SARS-COV-2 variant: Variant of Concern 202012/01 Public Health England.
  3. Haynes WA et al. High-resolution mapping and characterization of epitopes in COVID-19 patients. MedRxiv. https://www.medrxiv.org/content/10.1101/2020.11.23.20235002v1#p-5
  4. Shrock E et al. Viral epitope profiling of COVID-19 patients reveals cross-reactivity and correlates of severity. Science 2020 370(6520). https://science.sciencemag.org/content/370/6520/eabd4250

Jeff SoRelle, MD is Assistant Instructor of Pathology at the University of Texas Southwestern Medical Center in Dallas, TX working in the Next Generation Sequencing lab. His clinical research interests include understanding how lab medicine impacts transgender healthcare and improving genetic variant interpretation. Follow him on Twitter @Jeff_SoRelle.

Monitoring Bone Marrow Transplant Recipients

Hello everyone, it’s been quite some time since my last post. I hope everyone has remained safe and healthy during these times!

My last post dived into short tandem repeat (STR) analysis for bone marrow engraftment monitoring. Today is a presentation of a patient who was transplanted for treatment of acute myeloid leukemia (AML). With all patients (with minor exceptions), donor and pre-transplant recipient samples are taken before transplant. Their informative alleles are then identified and used to determine the percent of donor and any recipient cells in subsequent post-transplant samples.

This patient was unique in that we were not able to obtain the donor sample (they were transplanted outside of our system), and therefore we used a buccal swab for their pre-transplant recipient informatives.

Buccal swabs are chosen because they are a non-invasive way to obtain squamous epithelial cells. These cells are important because they are of the recipient origin and will not change. With this technique, it is essential that the patient has no mucosal inflammation or is not too rough when swabbing their cheek. Otherwise, the buccal sample may become contaminated with blood which would contain donor cells.

We then inferred the donor informatives from the data of a mixed sample and the buccal swab.

Calculation of recipient and donor percentage in a post-transplant sample is determined on specific formulas that utilize these informative alleles. But what happens when a patient relapses and new mutations or deletions are introduced into their genome, causing a change in these informative alleles?

In this case, the patient had a loss of allele at two loci (CSF1PO – allele 11 and D5S818 – allele 13) after having previously obtained full engraftment (Figure 1).

Figure 1. The pre-sample was acquired through a buccal swab. There was no donor sample that was acquirable, and therefore the donor informative alleles were inferred through available data. In September of 2019, the patient was at 100% donor. Almost a year later, the patient is now at 4% donor and missing previously identified recipient alleles, indicating a loss of allele/mutation. Brown box with “R” stands for recipient. Blue box with “D1” stands for donor. Green box with D1R stands for shared.

The importance here is that the true percent donor is 4% (Figure 2). If we take a look at the affected informative alleles, we see an erroneous result of 100% donor and NI (which means the locus is non-informative, eliminating it from the calculations). This expands on the importance of an analyst to be attentive to the results presented. While this case was clearly evident and was caught by our error measurements, it is theoretically possible to cause an issue, especially in cases where the recipient percentages may be smaller. Furthermore, this phenomenon stresses the importance of including multiple informative alleles in our analysis, which increases our measurement of confidence.1

Figure 2. CSF1PO and D5S818 are incorrectly representing the patient’s status. CSF1PO is representing the patient at 100% donor and D5S818 is automatically identified as a non-informative by our software. After automatic and manual loci ignores, the total percent donor was 4%

We know that a loss of allele (loss of heterozygosity) is the likely explanation because both loci are in locations specific to the disease. Looking at Figure 3 below, the two alleles were affected because they were both present on the long arm of chromosome 5. Further, this chromosome is known to be involved in AML, and is also, of course, associated with other disorders like MDS.2 Additionally, the patient had cytology testing that identified this as an affected chromosome.

Figure 3. CSF1PO and D5S818 are both located on the long arm of chromosome 5. CSF1PO’s location is 5q33.1 and D5S818’s location is 5q23.2.

This is an interesting phenomenon and one that shows in measurable terms how a patient’s status can affect their molecular results. It’s further an expression of the molecular mechanisms of a disease, one of my first measurable experiences of how a disease affects the physical molecular constituents of another human.

To me, this encounter was an expression of how complicated, and yet connected, the entire genome has been designed. I am continuously amazed and look forward to expanding my understanding of molecular science.

References

  1. Crow J, Youens K, Michalowski S, et al. Donor cell leukemia in umbilical cord blood transplant patients: a case study and literature review highlighting the importance of molecular engraftment analysis. J Mol Diagn. 2010;12(4):530-537. doi:10.2353/jmoldx.2010.090215
  2. Crow J, Youens K, Michalowski S, et al. Donor cell leukemia in umbilical cord blood transplant patients: a case study and literature review highlighting the importance of molecular engraftment analysis. J Mol Diagn. 2010;12(4):530-537. doi:10.2353/jmoldx.2010.090215

-Ben Dahlstrom is a recent graduate of the NorthShore University HealthSystem MLS program. He currently works as a molecular technologist for Northwestern University in their transplant lab, performing HLA typing on bone marrow and solid organ transplants. His interests include microbiology, molecular, immunology, and blood bank.

Massive COVID-19 Testing: 30 Million Tests/Week

Population COVID-19 testing

Population-wide testing to identify symptomatic and asymptomatic infections could be a powerful tool to control Coronvirus Disease 2019 (COVID-19) spread, but current global testing capacity does not permit widespread testing of asymptomatic individuals. These tests are still limited to individuals who are symptomatic with limited availability to those with recent exposure to an infected person.

Because of the high prevalence of asymptomatic COVID-19 infections, proposals from the Rockefeller Foundation for disease mitigation include widespread and frequent testing of the US population. In the United States, diagnostic testing for SARS-CoV-2, the causative virus of COVID-19 is currently >2 million per week. Estimates for US testing needs for population wide surveillance range from 30 to 300 million per week. In order to scale testing by an order of magnitude, novel technologies and rethinking current testing paradigms are needed. The NIH has initiated a rapid funding program to develop SARS-CoV-2 testing, and these new technologies may play a part. However, we can broadly conceptualize key problems to address in population-wide testing in the US. The first is high-sensitivity testing which identifies active infection and can be performed with massive throughput. The second is the logistics of gathering hundreds of thousands of samples to each testing laboratory each day.

Next Generation Solutions to COVID testing

Emerging technologies using targeted next-generation sequencing have been suggested as a potential solution to population-wide testing. The key features include 1) extraction free amplification 2) an easily collected specimen such as saliva, 3) nucleotide barcodes to enable sample pooling, and 4) a limited number of targets (to allow deeper sequencing, i.e. higher sensitivity). Illumina is selling a whole genome test for SARS-CoV-2, but this limits sequencing to 3,000 tests/ run. Another recent approval for a private testing lab uses only one target, and may allow it to increase to 100,000 tests/ day. And a recent protocol for LAMP-Seq in pre-print outlines how this could work in a scheme below. An attractive aspect of this approach is decentralized specimen processing.

Whereas Bill Gates has supported a portfolio approach to vaccines placing multiple bets on different processes in parallel, a similar approach should be applied to multiplexed sequencing methods. Two sequencing runs can be performed on a single instrument in a single day, which can process several thousand samples. However, sequencing is not the only step in sequencing; library preparation and specimen handling take significant amounts of time too.

Laboratory Logistics

This technology would represent an exponential expansion in analytic testing capacity, but clinical labs will require a similar escalation in logistic capacity. The largest clinical laboratories in the world process less than 100,000 samples per day. Clinical laboratories have a long history of automation with the first robotic specimen track systems developed in the 1980s. Engineering and clinical lab expertise should thus partner to innovate on methods to handle high volumes. This level of investment for an issue that is likely to fade in 2 years, is not attractive to most private health systems, so public investment from multiple states in regional reference labs is needed.

It is still hard to conceive the necessary scale up in sample processing can be achieve within the time frame needed, so I would also propose a de-centralized sample processing approach. This would include self-collection of saliva (a safe, effective sample type with similar sensitivity as nasopharyngeal swabs), drop-off sites, and processing at places like Pharmacies (>90% of Americans live within 5 miles of a pharmacy and they could be authorized to administer tests- just as they administer vaccines). This would introduce pre-analytic problems, but if the goal is frequent and high rates of testing, then we will have to accept certain losses in sensitivity (which currently is arguably better than it needs to be). Interestingly, pre-analytic concerns with saliva have not led to sample instability or degradation of RNA causing false negatives, as described in my last post. However, other factors could affect saliva quality: smoking, age, and genetic factors of water: protein ratio affecting viscosity.

Testing solutions should be considered in the context of the planned testing network. The specimen type should be easy for the patient to provide, processed with existing laboratory equipment and resulted electronically. For example, current COVID-19 testing is based on sample collections requiring a healthcare worker encased in personal protective equipment (PPE) utilizing a swab device. Testing needs to progress to a simpler solution such as saliva which can be collected by the patient in the absence of a swab or PPE. Preliminary studies have demonstrated that saliva is sample type comparable to nasopharyngeal swab. The ideal saliva sample would be collected into an existing collection tube type (e.g. red-top tubes) which are already compatible with existing laboratory automation. In aggregate, a person could spit into a tube at-home, have the tube sent to a laboratory, and in the laboratory the tube would be directly placed onto an automated robotic track system. 

Laboratory professionals need to provide a comprehensive plan for regional and national laboratory networks which can scale to provide overwhelming force to COVID-19 testing. No other profession or governmental organization understands testing as much as we do. Our understanding of managing samples from collection to result should be applied to the pandemic at hand. Until now most laboratorians in the US have focused on the immediate needs of providing testing for symptomatic patients and healthcare workers.

Vision for automated COVID-19 testing

One could envision an automated line of testing that moves samples through processing to allow multiplexing and combinations of samples to allow large numbers of patients to be tested at once (see below). This is feasible in some specialized centers, but would require investments in automation, bioinformatics, and interfaces for a seamless process (figure below). If testing mostly asymptomatic patients, it may also be possible to do this on pooled samples. The number of samples to pool would depend on the likelihood to having a positive result (this would require sequencing all individuals in a pool).

This represents a synthesis of ideas in decentralized specimen collection, laboratory automation and massive testing throughput with Next-Generation Sequencing, but unfortunately this is not yet a reality.

References

  1. Jonathan L. Schmid-Burgk et al. LAMP-Seq: Population-Sclae COVID-19 Diagnostics Using Combinatorial Barcoding. bioRxiv 2020.04.06.025635.
  2. The Rockefeller Foundation. National Covid-19 Testing Action Plan Pragmatic steps to reopen our workplaces and our communities. 2020.
  3. Cahill TJ, Cravatt B, Goldman LR, Iwasaki A, Kemp RS, Lin MZ et al. Scientists to Stop COVID-19.  OR Rob Copeland, Wall Street Journal (2020) The Secret Group of Scientists and Billionaires Pushing a Manhattan Project for Covid-19. April 27
  4. https://www.illumina.com/products/by-type/ivd-products/covidseq.html

-Jeff SoRelle, MD is a Chief Resident of Pathology at the University of Texas Southwestern Medical Center in Dallas, TX. His clinical research interests include understanding how the lab intersects with transgender healthcare and improving genetic variant interpretation.

Biomarker Testing for Cancer Patients: Barriers and Solutions Part 6

This month we will finish the discussion the common barriers to biomarker testing for cancer patients in the community. Lengthy complex reports is a relatively straightforward barrier to address, so I will pair it with the lack of education on guidelines barrier to complete this blog series on barriers to biomarker testing.

As you may recall, these are the top 10 barriers that I’ve seen to biomarker testing in the community:

  1. High cost of testing.
  2. Long turnaround time for results.
  3. Limited tissue quantity.
  4. Preanalytical issues with tissue.
  5. Low biomarker testing rates.
  6. Lack of standardization in biomarker testing.
  7. Siloed disciplines.
  8. Low reimbursement.
  9. Lengthy complex reports.
  10. Lack of education on guidelines.

Lengthy Complex Reports

Laboratory issued reports are typically developed by the lab and are often written in a manner that is easy to understand for other laboratorians. I’m guilty of writing long interpretive comments that are attached to every molecular diagnostics results. I would get irritated when the physician would call and ask questions that in my mind were clearly addressed in the interpretive comment. I thought the issue was they were not reading the comments (and this could be true). I now understand that the issue is that the comments were not written for the end-user.

When insourcing NGS I was fortunate enough to get feedback from the multidisciplinary team in the Molecular Steering Committee. One of the complaints that I heard loudly locally, that also resonated in the community, was the reports for NGS were way too long and they didn’t find value in half of the information that was in the report. When were shopping for the right cloud-based reporting software, I kept the feedback in mind from the oncologists. I was actually able to get proto-type reports from 3 different companies and provide them to the oncologists for them to score and provide feedback on the layout. This was invaluable in developing a report that worked well for the treating physician and not the laboratory.

Some of the feedback they gave that made a direct impact into the report we created was: bold the patient’s name so they can easily find it, use patterns as well as color-coding for drug resistance/sensitivity in case the document is faxed, and tell them everything they need to know to make treatment decisions on page one. These are things that were not intuitive to me. Having end-user feedback helped us generate a more useable report and enlightened me that the report needs to be written to an oncology audience.

Lack of education on guidelines

I’ve had the opportunity to do a great deal of educating around biomarker testing in the community. Physicians and nurses in the community want to provide guideline-driven care. Often when we are educating on changes to guidelines, it’s the first time the providers have heard of the change. NCCN for lung cancer alone had at least 7 updates in 2019. It’s amazing that the guidelines are able to keep up with the ever changing science and drug approvals; however it’s incredibly difficult to keep track of the changes.  

In large institutions we are fortunate enough to have specialized physicians that help keep the rest of us informed of changes in their area of expertise. Community physicians typically see and treat all types of cancers and don’t always have the network of specialists to keep them informed of changes for every cancer type. Many of them also do not have the time to attend conferences due to heavy workload.

 In order for the community physician to be informed of all of the changes to guidelines for every tumor type, we need to make sure the information is provided in a variety of methods. The information needs to be easily accessible. I have found that educational programs work well when brought to the community rather than trying to get the community to come to them. Pharmaceutical and diagnostic companies and even reference laboratories now have teams of individuals in roles that are intended to educate and not sell. They can provide in office education, facilitate webinars, lunch and learns, and dinner programs. If there is a champion for biomarker testing within the facility, you can develop your own educational program to be delivery locally at grand rounds. We discuss changes to guidelines within our Molecular Steering Committee. I’ve also talked to institutions where this education is given during tumor boards.

I don’t think there is a bad forum for education. Some physicians may prefer getting guideline updates from twitter; others will be more comfortable with a discussion with an expert, regardless of the medium it is important that we help facilitate education of guidelines in order to increase biomarker testing rates in the community.

-Tabetha Sundin, PhD, HCLD (ABB), MB (ASCP)CM,  has over 10 years of laboratory experience in clinical molecular diagnostics including oncology, genetics, and infectious diseases. She is the Scientific Director of Molecular Diagnostics and Serology at Sentara Healthcare. Dr. Sundin holds appointments as Adjunct Associate Professor at Old Dominion University and Assistant Professor at Eastern Virginia Medical School and is involved with numerous efforts to support the molecular diagnostics field. 

Extraction-free and Saliva COVID-19 Testing

Much has changed quickly with SARS-CoV-2 virus (COVID-19) testing. Several commercial options are now available. Labs have less problems getting control material (positive samples are no longer in short supply). And labs that opted to bring on testing are now running multiple versions of COVID-19 molecular tests with a combination of high speed platforms or high throughput. Rapid cartridge tests are used for clearing people from the ED/ removing contact isolation on inpatients while the high throughput assays are used for routine screening.

However, several bottlenecks still exist. There are shortages of nucleic acid extraction kits, collection swabs and viral transport media. Fortunately, some recent studies have demonstrated preliminary evidence for using alternative sample types, collection methods, and storage conditions.

One of the first tenets of molecular diagnostics is isolation and purification of nucleic acid. Therefore, it was surprising to see a report on an extraction-free COVID-19 protocol from Vermont (Bruce EA et al.). This study initially analyzed two patient samples and showed drops in sensitivity of ~4Ct cycles. While this would not be suitable for low level detection, many viral samples have high levels of virus that still would permit detection. The team went on to test this method on 150 positive specimens from the University of Washington and found 92% sensitivity with 35% sensitivity at the low viral load range (Ct value> 30). This was improved with a brief heat inactivation step (Table 1). This was similarly seen in a study from Denmark, where brief heat inactivation of extraction-free methods (Direct) had 97% specificity in 87 specimens (Table 2).

Table 1. Vermont study comparing sensitivity of direct RT-PCR (no extraction step) with the validated results of 150 specimens coming from the University of Washington.
Table 2. Denmark study found extraction-free protocols (Direct) were comparable to extracted RNA (MagNA Pure extraction method) detection in 87 specimens.

Some similar studies out of Chile also showed extraction-free protocols on a larger number of specimens, and they reported a loss in sensitivity varying from 1-7 Ct cycles depending on the primers used.

Figure 1. P1 and P2 are patient 1 and 2. NSS indicates a nasal swab sample where RNA was extracted. RNA indicates a sample with no RNA extraction.

As this novel Coronavirus has an RNA-based genome, RNA is the target of molecular tests. As RNA is susceptible to degradation, there have been concerns over sample storage. Should it be refrigerated? Frozen? How do multiple freeze-thaw cycles impact specimen stability? Are there viable alternatives to viral transport media? One preliminary study explored these questions very nicely. They took X multiple sample types (NP, BAL, saline storage media) and stored them at 20C, 4C, -20, and -70 for multiple days up to 1 week and then analyzed the level of virus detected. In each case, the loss in sensitivity was minimal (<2 Ct cycles from day 0 to day 7) at room temperature with comparable results at lower temperatures (Table 3).

Table 3. Stability of SARS-CoV-2 RNA detected by the Quest EUA rRT-PCR. VCM- viral culture media; UTM-R Copan’s transport medium; M4-microtest media; BAL- bronchoalveolar lavage.

Lastly, alternative sample types such as saliva will help break the bottleneck in swabs and viral transport media. I was surprised to hear about this being a suitable alternative. Having worked with saliva for DNA analysis, I know it can be contaminated, of variable quantity, includes digestive enzymes and is viscous (slimy). These are not characteristics a lab would look for in a specimen type being used for high-throughput testing where several sample failures could occur. But these researchers from Yale showed measurable levels of SARS-CoV-2 that facilitated even higher sensitivity than nasopharyngeal swabs (Wylie AL et al).

Figure 2. SARS-CoV-2 titers are higher in the saliva than nasopharyngeal swabs from hospital inpatients. (a) All positive nasopharyngeal swabs (n = 46) and saliva samples (n = 39) were compared by a Mann-Whitney test (p < 0.05). Bars represent the median and 95% CI. Our assay detection limits for SARS-CoV-2 using the US CDC “N1” assay is at cycle threshold 38, which corresponds to 5,610 virus copies/mL of sample (shown as dotted line and grey area). (b) Patient matched samples (n = 38), represented by the connecting lines, were compared by a Wilcoxon test (p < 0.05). (c) Patient matched samples (n = 38) are also represented on a scatter plot.

With a much-needed increase in testing for this country, optimizations need to be implemented to improve efficiency. These steps alone will not be enough, but if we can have extraction-free testing of saliva collected at home, this would provide a substantial benefit to bringing easy testing to everyone.

UPDATE: Since this was written, the first FDA EUA was authorized for an at-home saliva collection kit for use at the Rutger’s clinical genomics lab (https://www.fda.gov/media/137773/download).

References

Please note: many of these references were on pre-print servers and have not been peer-reviewed.

  1. Bruce EA, Huang ML, Perchetti GA, et al. DIRECT RT-qPCR DETECTION OF SARS-CoV-2 RNA FROM PATIENT NASOPHARYNGEAL SWABS WITHOUT AN RNA EXTRACTION STEP. 2020. https://www.biorxiv.org/content/10.1101/2020.03.20.001008v2.full#T2
  2. Wyllie AL, Fournier J, Casanovas-Massana A, Campbell M et al. Saliva is more sensitive for SARS-CoV-2 detection in COVID-19 patients than nasopharyngeal swabs. medRxiv 2020. https://www.medrxiv.org/content/10.1101/2020.04.16.20067835v1#disqus_thread
  3. Fomsgaard AS, Rosentierne MW. An alternative workflow for molecular detection of SARS-CoV-2 – escape from the NA extraction kit-shortage, Copenhagen, Denmark, March 2020. https://www.medrxiv.org/content/10.1101/2020.03.27.20044495v1.full.pdf
  4. Rogers AA, Baumann RE, Borillo GA, et al. Evaluation of Transport Media and Specimen Transport Conditions for the Detection of SARS-CoV-2 2 Using Real Time Reverse Transcription PCR. JCM 2020.
  5. Beltran-Pavez C, Marquez CL, Munoz G et al. SARS-CoV-2 detection from nasopharyngeal swab samples without RNA extraction. bioRxiv 2020. https://www.biorxiv.org/content/10.1101/2020.03.28.013508v1.full.pdf

-Jeff SoRelle, MD is a Chief Resident of Pathology at the University of Texas Southwestern Medical Center in Dallas, TX. His clinical research interests include understanding how the lab intersects with transgender healthcare and improving genetic variant interpretation.