Last month we discussed the rules associated with evaluating your PT results, and how to investigate any unsuccessful surveys. In the last of this 3-part series we’ll review ways to utilize your PT reports to check for trending in your patient values – shifts, trends and bias. Your PT results can help show you developing problems and allow you to correct them, before they become failures or begin to affect patient care. Before declaring a failure as a ‘random error’, be sure that it truly is.
Accuracy & Systematic Errors
Accuracy describes how close your measured value is to the reference value – did you obtain the correct result? This will be affected by systematic errors, such as using expired or degraded reagents, changes in lot numbers or calibration values, or instruments with analytical lamps or lasers near the end of their use life. Systematic errors are reproducible inaccuracies that occur in the same direction; all results will be falsely low or all results will be falsely high. If systematic errors are present, all results will show similar deviations from the true value. Bias is a measure of how far off your results are from their true intended value.
Precision and Random Errors
Precision on the other hand refers to the overall agreement of results upon replicate testing – will you get the same value if you repeat the test? Precision is affected by random errors, such as incomplete aspiration of a sample or reagent due to fibrin clots or air bubbles, operator variability in pipetting technique, or temperature fluctuations. Random errors are statistical fluctuations in the measured data due to the limitations of the assay in use. These errors will occur in either direction from the mean, unlike systematic errors that will be on the same side. Imprecision can be measured and monitored by evaluating the standard deviation (SD) and coefficient of variance (CV) for an assay.

Let’s look at some example PT results from CAP, and see what hints these reports reveal to us.
- Albumin: Although all results passed and were graded as ‘acceptable’, there are still issues that should be looked into. For the last 3 surveys in a row, the plot shows that nearly all samples have been on the same right side of the mean. When comparing the value of the % relative distance from the first survey to the most recent one, you can see that the values are trending worse and getting closer to being unacceptable if the pattern continues. Additionally, be mindful of the standard deviation index (SDI) value reported. This is a measure of your bias, and how far off your values are from the mean. It should be defined within your Quality System Manual (QSM) the values which should trigger an investigation, but as a general rule, anything >±2.0 indicates a potential issue. (https://unityweb.qcnet.com/Documentation/Help/UnityWeb/399.htm)
- Alkaline Phosphatase: Again all results passed, but 3/5 samples have SDI values >±2.0. The first survey had all values to the right of the mean, the second survey was a nice tight even mix of +/- bias, and now with the most recent survey all values are appearing to the left of the mean. If this shift coincides with a change in lot number, a calibration may be necessary to get results back on target to help lower the SDI values.

- GGT: Although only 1 sample was graded as unacceptable, all of the results for this recent survey were at risk of being failures due to how close they were to the upper limit of acceptability. Results like this should be very carefully evaluated to ensure that there is no impact on patient care. Provided the sample stability has not been exceeded, all 5 samples should be repeated. If the repeat values are closer to the target mean, you will need to identify what went wrong on the day the samples were originally tested. If the repeat values are still grossly far from their intended target, a full patient lookback would need to be performed from the time the samples were originally tested until the day they were repeated, as there is a systemic problem that has now continued for weeks or longer.

- Vancomycin: Similar to the albumin example above, these results show a trend occurring between the first survey and the most recent; however unlike albumin these are moving in the correct direction. Values are getting closer to the target mean, and SDI values are decreasing, suggesting that any corrective actions implemented after the last survey were successful.
- Lithium: This shows a good example of what you hope all of your quantitative proficiency results will look like. There is a nice distribution of results on both sides of the mean, and SDI values are all relatively low. Values such as these allow you to have complete confidence in the accuracy of your patient results.

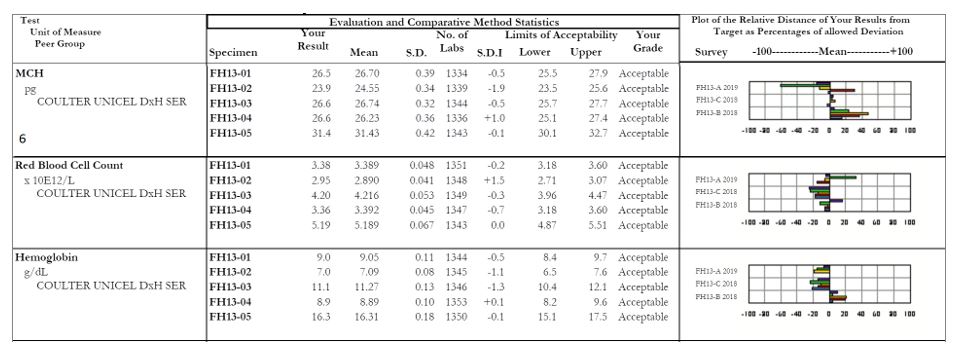
- MCH: Focus on sample #2, with an SDI of -1.9. The other samples within this survey all appear fine, but it looks as though there was truly a random error with sample #2. When we look at the affiliated analytes we see a similar issue with the RBC count of sample #2, which coincides with our decreased MCH (a reminder for our non-hematology readers, MCH = (Hgb x 10)/RBC). For any calculated values, be sure to evaluate the all parameters together as well as individually to serve as a common sense check that your results are appropriate and truly make sense.
It is important to have a robust quality assurance program that outlines what to monitor, key decision points for when to take action, and guidance on what those actions should include. Your proficiency testing results can provide you with a ton of useful information to evaluate the overall quality of laboratory, and help provide confidence in the patient values being reported out as well.

-Kyle Nevins, MS, MLS(ASCP)CM is one of ASCP’s 2018 Top 5 in the 40 Under Forty recognition program. She has worked in the medical laboratory profession for over 18 years. In her current position, she transitions between performing laboratory audits across the entire Northwell Health System on Long Island, NY, consulting for at-risk laboratories outside of Northwell Health, bringing laboratories up to regulatory standards, and acting as supervisor and mentor in labs with management gaps.

Kyle, thank you for this very useful series.. have added the links to my website to share with others. https://www.smartlabtools.com/proficiency_testing.html
Thank you very much!