Authors: Dr. Maryam Zenali (Department of Pathology), Dr. Eric Ganguly (Department of Gastroenterology), and Dr. Christopher J. Anker (Division of Radiation Oncology), University of Vermont Medical Center
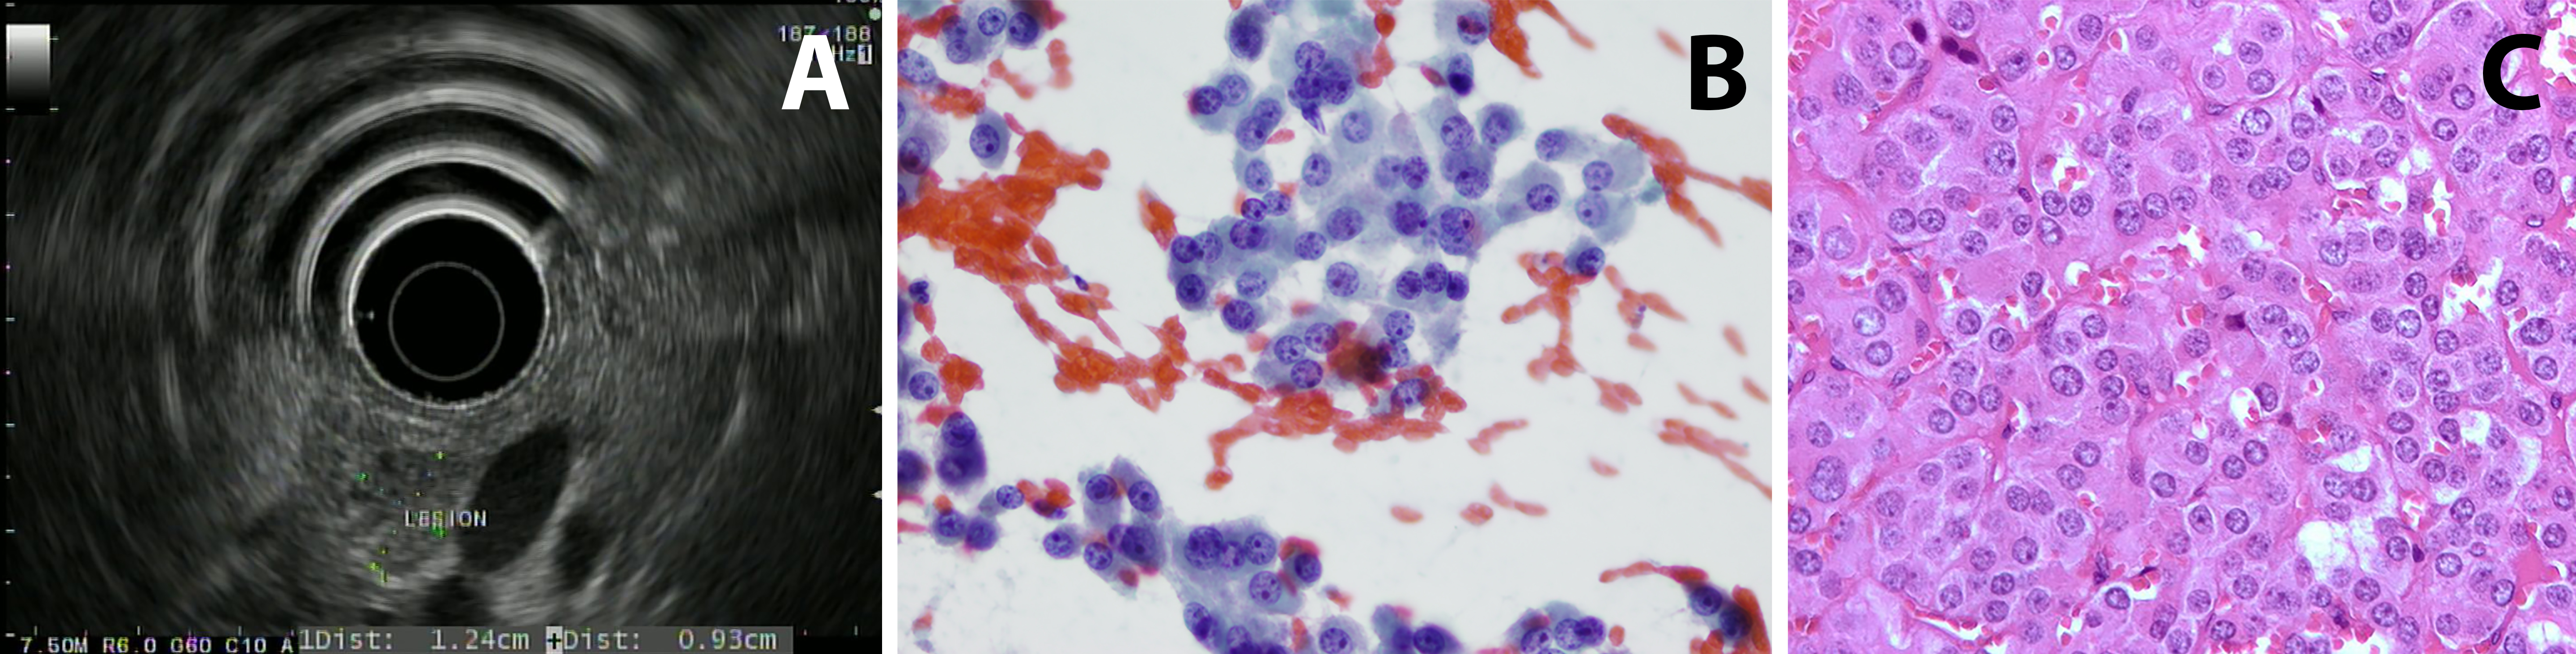
Case 1: Patient 1 is a 75 year old man with a history of gastroesophageal reflux disease (treated with a proton-pump inhibitor) who had an episode of diaphoresis and altered mental status at 3:30 am. He was found to have a glucose of 20 when rescue arrived. He was brought to the ED and symptoms resolved after glucose administration. Work-up showed fasting C-peptide of 3.5 (normal range: 1.1-4.4 ng/mL) ruling out excess insulin use; proinsulin was elevated at 300 (normal range: 3-20 pmol/L). Serum chromogranin A was noted to be mildly elevated. He had a CT scan of the abdomen that did not show any abnormal enhancement or concerning lesion. Endoscopic ultrasound (EUS) imaging demonstrated a slightly hypoechoic mass in the pancreatic head with a hyperechoic halo margin. The mass was adjacent to, although not invading, the portal vein. The remainder of the pancreatic head had a normal echotexture (figure 1A). Fine needle aspiration and biopsy of the lesion were performed; microscopic images are provided (figures 1B and 1C).
Histology: A relatively monotonous, well-differentiated tumor with regular, round salt-and-pepper chromatin and eosinophilic cytoplasm. There were only rare apoptotic cells and no mitosis. 1% of tumor nuclei were immunoreactive with MIB-1 (Ki67 K2 Leica). Tumors cells were diffusely and strongly positive for synaptophysin (27G12, Leica), chromogranin (LK2H10, Ventana) and keratin (AE1-AE3, Biocare) but negative for makers such as TTF1, CK7, Beta-catenin and GATA-3.
Several aspects influence whether people learn from experiences in order to become a better leader. These variables can either be personal traits of the individual learner or situational aspects of the circumstances. Both personal and situational variables of experiential learning increase the development of leaders.
Personal Variables
Being exposed to experiences does not necessarily mean that people learn from them. There are some personal attributes necessary to foster learning from experiences in order to develop one’s leadership potential. The main variable that influences experiential learning is the capacity and practice of self-reflection. Being able to draw lessons from experiences is indeed what drives leadership development and self-reflection increases the number of lessons noticed in each experience. Furthermore, experiences that are challenging promote learning. How challenging an experience is can be seen as situational, however it is also personal as some people are more drawn to challenging experiences than others. Additionally, motivation to learn increases experiential leadership development. Whether the learning is motivated through goals, actions, or to simply seek knowledge, motivation influences leadership development.
In addition to being reflective, motivated, and challenged, experiential learners also need to think and act. Thinking is important because it allows the learning to plan and strategize. Finally, acting is one of the most critical aspects of learning, because it closes the cycle of learning and creates the next cycle of experiential learning.
Furthermore, assessments bring a deep level of self-awareness about their behavioral and thinking patterns, behaviors, and preferences. Knowing what one does well, where one can improve, and where the developmental gaps are is essential for leadership development. The experience with assessment is both a personal and situational variable, because how people are rated or rate themselves depends on the situation and on the personality of the person being rated. Finally, vicarious learning is learning through other people’s experiences. However, not everyone who witness other people’s leadership challenges, solutions, and behaviors develop their own leadership skills. Therefore, this is both a situational and personal variable as a person needs to be motivated to learn but also needs access to a vicarious learning opportunity.
Situational Variables
Some of the factors that influence learning from experiences are situational. This means that people have to be in a specific type of situation in order to not merely experience something but to increase their leadership effectiveness based on that experience. Experiences in themselves are situational; for the most part one cannot make certain experiences happen but they happen to people instead. However, there are three specific aspects of employment that people can seek that foster situational learning opportunities. The first one is getting a new job, changing job status, or job location. There is a tremendous amount of experiential learning that takes place when one of these aspects of a current job changes. The second is a change in task-related characteristics, such as a process or systems change. Thirdly, obstacles increase learning. Such obstacles can be difficult supervisors or employees, another company launching a similar program, or a crisis. All these experiences promote learning because jobs are central in leadership development, as well as, different assignments and experience with obstacles.
Support is an additional situational variable that increases learning. Support promotes learning because it makes people feel reassured and safe. Feeling safe also increases learners’ motivation, competency, and self-efficacy, which all promotes learning. Additionally narrative accounts shared by leaders and the organization promotes learning from experience, even if the narratives are fictional. Hearing stories about effective and ineffective leadership increases listeners’ own leadership skills through cognitive elaboration and transportation. Finally, allowing people to experience the consequences of decisions increases their learning and develop their leadership potential. Experiencing the consequences will increase people’s understanding of the impact of decisions and how departments and tasks are interconnected.
People learn in many different ways, but we all go through experiences, whether they happen to people directly, through vicarious learning, or through narratives. The better leaders can maximize learning from experiences, the more prepared the next generation of leaders will be to tackle challenges, dilemmas, and problems.
-Lotte Mulder earned her Master’s of Education from the Harvard Graduate School of Education in 2013, where she focused on Leadership and Group Development. She’s currently working toward a PhD in Organizational Leadership. At ASCP, Lotte designs and facilitates the ASCP Leadership Institute, an online leadership certificate program. She has also built ASCP’s first patient ambassador program, called Patient Champions, which leverages patient stories as they relate to the value of the lab.
In the Iliad, Homer described the chimera as “a thing of immortal make, not human, lion-fronted and snake behind, a goat in the middle, and snorting out the breath of the terrible flame of bright fire (1).” This mythical creature has a lion’s head, a goat’s middle and the tail of a serpent, and the siting of a chimera was considered to be an omen for disaster! Thankfully, not so much in blood bank. Though ABO discrepancies can be a challenge, even most chimeras can easily be resolved with a few additional steps and a patient history.
Figure 1. The mythical chimera.
To review, an ABO discrepancy occurs when unexpected
reactions occur in the forward or reverse grouping, or the forward typing does
not match the reverse typing. Some weak subgroups of A (notably A3)
are known for giving mixed field reactions. Weak activity with anti-A, anti-B or
anti-D can also in result mixed field reactions in leukemia patients. In these examples,
the mixed field reactions are due to the weakened expression of the
corresponding antigens.
Chimerism is the presence of 2 cell populations in a single
individual. There are scenarios
where ABO discrepancies causing mixed field reactions indicate an apparent
chimera. A group A positive patient who received several units of O
negative blood will have mixed field reactions due to the presence of two blood
types in their peripheral blood. This would be a temporary situation. A patient
who received a bone marrow or stem cell transplant from a non-group identical
donor will have 2 populations of red blood cells until the new type is
established. We refer to these as artificial chimera cases, as the second blood
type is not naturally occurring, but present due to the introduction of a
different blood type via transfusion or transplantation.
Table 1. Group A pos patient who received several units of group O neg red cells
Like the
mythical beast, a chimera in biology describes an organism that has
cells from two or more zygotes. When chimerism exhibits only in the blood, the phenomenon
can be termed an artificial chimerism, as described above, as dispermic
chimerism or as twin chimerism. Dispermic chimerism occurs in other animal
species but is a rarity in humans. It occurs when 2 eggs are fertilized by 2
sperm and these products are fused into one body. In this case, the chimerism
is not limited to blood, but may also result in hermaphroditism, or two
different skin colors or eye colors.
Twin chimerism occurs when, in utero, one twin transfuses
blood cells, including stem cells, to
the other. Sine the fetal immune system is immature, the host does not see
these transfused blood cells as foreign antigens. The stem cells can proliferate and this
results in the production of cells from both the donor and the host for the
rest of the individual’s life. Two non-compatible blood groups can co-exist in
one individual! This phenomenon is usually discovered by coincidence during a
routine type and screen. This patient could be found to have mixed field or
weak reactions on ABO typing, or could have missing reactions in the back type,
all with no history of transfusion, transplantation and no disorder that could
explain the findings. What is a tech to do? An important step in resolving all
ABO discrepancies is to review patient history.
In 1953 a human chimera was reported in the British Medical Journal. A woman was found to have blood containing two different blood types. Apparently this resulted from her twin brother’s cells living in her body (2). More recently, in 2014, a case described in Blood Transfusion describes a 70 year old female who was found to have mixed field reactions with ABO and RhD typing during routine testing before surgery. She had no history of transfusion or transplantation, and a history of seven pregnancies. Repeat testing by other methods and with different reagents gave the same results. On further questioning, the patient affirmed that she had been born a twin, but her twin brother had died as an infant. Since chimerism was suspected, molecular typing and flow cytometry were performed. The presence of male DNA was found by PCR testing and flow cytometry confirmed two distinct populations of red blood cells (3).
Twin chimeras with mixed blood types of 50%/50% or 75%/25%
are easily picked up in ABO typing as mixed field reactions. A twin chimera with
95% group O blood and 5% group A may show a front type of a group O and a back
type that lacks anti-A . Because there is immune tolerance to A cells from the
twin, the expected naturally occurring anti-A is not present. On the other
hand, a twin chimera who is primarily group A with 5% O cells would not be
recognized as a chimera in routine ABO typing.
Table 2. Group O chimera with 5% minor cell population A cellsTable 3. Group A chimera with 5% O cells
How common is blood group chimerism? A 1996 study found that such blood group chimerism is not rare. Though we do not often encounter this in blood bank, their study of 600 twin pairs and 24 triplet pairs showed that this occurs more often than was originally thought, with a higher incidence in triplets than in twins. Because it does not cause any symptoms or medical issues, many such chimeras go undetected. In addition, the study found that many of these chimeras had very minor second populations, making them undetectable in serological testing. In blood bank, we generally test for ABO/RH and do not test for other antigens in routine testing. The study used 849 marker antigens. They also used a very sensitive fluorescent technique which they developed for detecting these very subtle minor populations. This study showed that while chimeras are not rare, they are something that, with present testing methods, we will not encounter too often (4).
Dual cell populations induced by chimeras have been the subject
of many studies. Historically, most chimeras were naturally occurring. With
newer medical interventions and therapies, we may see more situations that lead
to mixed cell populations. Transfusion, stem cell transplants, kidney
transplantation, IVF and artificial insemination can all lead to temporary and
sometimes permanent chimeras. These can present challenges in the blood bank
laboratory in interpreting results and for patient management. A question of
chimera presentation can usually be solved by putting on our detective hats and
investigating patient history. Further testing can be done with flow cytometry
and molecular methods, if needed. Modern medicine may have given us more blood
bank challenges but modern technology has equipped us with newer methods to
solve them. A chimera is no longer a sign of impending trouble!
References
Homer, Iliad. In Richmond Lattimore’s Translation.
Bowley, C. C.; Ann M. Hutchison; Joan S. Thompson; Ruth Sanger (July 11, 1953).“A human blood-group chimera” (PDF).British Medical Journal: 8
Sharpe, C.; Lane, D.; Cote J.; Hosseini-Maaf, B.; Goldman, M; Olsson, M.; Hull, A. (2014 Oct ). “Mixed Field reactions in ABO and Rh typing chimerism likely resulting from twin hematopoiesis”, Blood Transfusion:12(4): 608-610
-Becky Socha, MS, MLS(ASCP)CM BB CM graduated from Merrimack College in N. Andover, Massachusetts with a BS in Medical Technology and completed her MS in Clinical Laboratory Sciences at the University of Massachusetts, Lowell. She has worked as a Medical Technologist for over 30 years. She’s worked in all areas of the clinical laboratory, but has a special interest in Hematology and Blood Banking. When she’s not busy being a mad scientist, she can be found outside riding her bicycle.
Performance improvement (PI) metrics are a great way to assess the overall quality of your laboratory program. They allow you to track vital data related to CMS outcome measures, which can directly impact the financial well being of your organization. However, labs should be careful when choosing which metrics to monitor, and should routinely evaluate if the metrics they’re using are still meaningful to them.
Even a
small laboratory will generate a ton of data throughout the year. The key
questions to ask yourself are: 1) What do I want to know? 2) What will I do
about it once I have the answer?
There
may be different sets of metrics that laboratories will have to monitor and
report, depending upon who the target audience of the final data analysis will
be. Metrics and reports can be generated for your patients/customers, internal
laboratory staff, management, and senior leadership. You may also be called
upon to share your metrics with regulatory agencies as well to prove the
effectiveness of your quality assurance program.
Ensure
your reports are relevant and meaningful to the audience they are being shared
with. Customer/Patient centered metrics can include items such as satisfaction
survey results, average waiting time for outpatient blood drawing locations,
and average cost/revenue per test. Internal laboratory staff metrics can
include turnaround time reports for STAT tests, compliance with critical call
notifications to providers, and percent completion for required monthly
maintenance tasks. Higher level metrics that can be reported to management and
administration may include performance on proficiency testing surveys,
regulatory inspection results, and percent of corrected reports that were
issued.
If
goals have been met and sustained consistently, consider raising the bar and
challenging yourself even further. Each metric should have 3 goals: 1) Minimum
Threshold (must be achieved each review period), 2) Annual Goal (desired
overall goal to account for monthly fluctuations in the data), 3) Stretch Goal
(motivational tool, achievable but not guaranteed a high rate of success). Increase
your minimum threshold limits to be closer to your stretch goals, and see what
your particular organization can realistically meet and sustain. Be careful to
not set unrealistic expectations, as this can lower morale and result in
misleading interpretations of the data. Work with your clinicians and
regulatory agencies to determine appropriate, and realistic goals, and utilize
national benchmark standards when available.
Metrics
that were added to address and monitor a specific known issue or problem should
be evaluated for necessity once the issue is corrected. Consider reducing the
monitoring of these items from monthly down to quarterly, semi-annually, or
annually until you have confidence that it no longer requires monitoring.
When
issues are identified, a root cause investigation should be performed with the
intent of identifying the true cause of the problem – not to point blame to a
particular person. The depth and intensity of your investigation will depend
upon the specific metric which failed to meet its goal.
Properly
identify the problem.
To learn from our mistakes, we must first properly identify them. What may seem
like an obvious root cause, may not be the real reason for an issue. For
example, turnaround time metrics – if you did not complete STAT troponin tests
in <45 minutes, simply purchase a new instrument that is faster. Well, it’s
not quite that simple.
Break
it down further into pre-analytic, analytic, and post-analytic times. Is the
bulk of your 45 minute window taken up in the pre-analytic phase? Are samples
being held in a central receiving area for 20 minutes and batched before being
brought to the chemistry department? Are you testing serum (which needs to
first clot before being spun) or plasma (which can be spun down immediately)?
Is there a delay in verifying/releasing results into your LIS where
autoverification would improve this process?
Before
attributing instrument downtime as a cause, confirm that the outliers were in
fact during the time period when the instrument was down. There’s a higher
chance you have a pattern of poor TAT performance around change of shifts or
meal breaks, than during a 6hr downtime on a single day in the month. Also look
at how you are analyzing your metrics to ensure they are accurate. Are you
including add-on tests based on their original received time, or based on when
the troponin was added to the original order?
Develop
a corrective action/preventive action plan. Based on what you identified to be the true root
cause(s) that contributed to poor PI metrics, develop a plan for addressing
these weaknesses. Identify who specifically will be responsible for performing
each step in the action plan, and who will be held accountable for ensuring it
was performed.
Implement
the plan(s). Document
the date the corrections were fully implemented, along with any delays or
obstacles encountered.
Collect
and analyze more data.
Depending on the severity of the failed metric, you may want to begin analyzing
the effectiveness of your improvement plan immediately. If there was a spike in
the number of employee safety incidents reported last month due to ongoing
construction in a department, the work conditions should be monitored
daily/weekly for improvements.
Conversely,
looking at data too soon may not paint an accurate picture of the true
effectiveness of your corrective actions. Some corrective action plans may
require several steps or phases for full implementation. For example, a process
change will require an update to your procedure manual, retraining of all
staff, and then rolling out the new process. This may take several days-weeks
before 100% implemented and improvements can be detected.
Monitor
the results. Check
for sustainability of your corrections – staff may be on their best behavior the
first week after being spoken to, but can return to old habits after that. They
may not fully understand that although one process is easier for them, it is
adversely affecting the overall performance of the entire lab team.
If you
are consistently struggling to meet your metrics, consider looking for ways to
implement lean process changes. Upgrading to a STAT spin centrifuge may save
you 5 minutes on the pre-analytical side; but you may still have room for
improvement. Do you consistently receive 20 samples at a time, meanwhile your
centrifuge will only hold 8 tubes? Do you receive tubes of different sizes
(adult vs pediatric), and is your centrifuge capable of quickly and easily
interchanging inserts to accommodate both types?
Ultimately,
be sure to engage your frontline staff and listen to their opinions on what is
working, and what could be improved upon. They are the ones doing the tasks day
in/day out, and are your subject experts on where some of the shortfalls may
lie. Even if the answer is simply not having enough staff available, having
detailed analytical metrics can help management justify the cost of adding
additional team members, and also pinpoint the exact days and times where the
help is needed most.
Bio
Kyle
Nevins, MS, MLS(ASCP)CM is one of ASCP’s 2018 Top 5 in the 40 Under
Forty recognition program. She has worked in the medical laboratory profession
for over 18 years, and is currently employed at Northwell Health Laboratories
on Long Island, NY. In her current position as a Laboratory Supervisor for the Northwell
Consulting Team, she transitions between performing laboratory audits across
the entire Northwell Health System, consulting for at-risk laboratories outside
of Northwell Health, bringing laboratories up to regulatory standards and
acting as supervisor and mentor in labs with management gaps.
-Kyle Nevins, MS, MLS(ASCP)CM is one of ASCP’s 2018 Top 5 in the 40 Under Forty recognition program. She has worked in the medical laboratory profession for over 18 years. In her current position, she transitions between performing laboratory audits across the entire Northwell Health System on Long Island, NY, consulting for at-risk laboratories outside of Northwell Health, bringing laboratories up to regulatory standards, and acting as supervisor and mentor in labs with management gaps.
This month
our study results were published in a special edition of Clinical Chemistry describing how laboratory values in transgender
men and women when taking hormone therapy. While retrospective, we hope that
this information will help improve transgender medicine.
There were
many interesting results found in the study and I hope to describe bits of them
in greater detail each month.
We
wondered what we might find if we took a broad, unbiased approach comparing all
laboratory parameters commonly measured by physicians. Just because there are
no sex-specific differences in analytes, changes could still occur secondary to
exogenous hormone use.
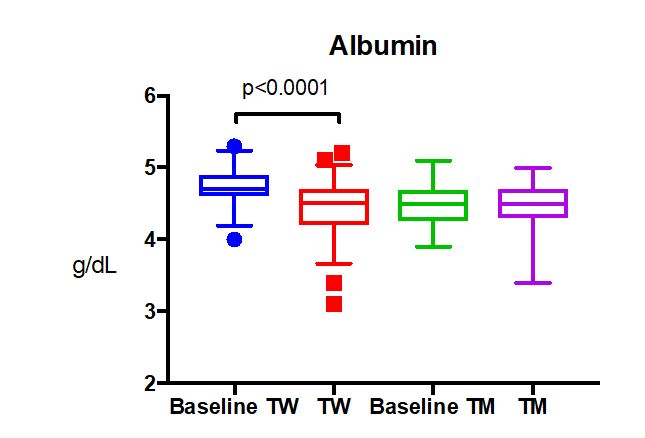
Albumin, which is the principle protein in our blood, was found to be decreased in transgender women after taking at least 6 months of estradiol therapy (p<0.0001)1. This was unexpected, because one reference range for albumin is used for cisgender males and females.
Frequently,
changes in lab values move in opposite directions for transgender patients
taking estradiol vs. testosterone (ex. hemoglobin goes up with testosterone and
down with estradiol). We wondered if a similar opposite change might occur in
albumin for transgender men taking testosterone. However, there was no change
in albumin levels from baseline for transgender men.
The cause
of decreased albumin was not readily available, but several factors could be
influential. Albumin levels reflect the long term nutritional status of a
patient as it has a long half life for turnover (t½= 3-4 weeks). Thus, the
change in albumin could reflect a dietary change in transgender women. However,
in the chart review there was nothing to suggest a substantial change in diet.
While several of the patients would go on diets and lose weight, the weight
loss was (unfortunately) often short lived (< 1 year). Looking towards a
more objective reflection of dietary changes, the body mass index was nearly
the same for transgender women pre-hormone therapy vs. while on hormone therapy
(BMI: 27 vs 29, p>0.05).
Some
studies have shown an increased prevalence of disordered eating behaviors among
transgender individuals2, which could affect overall nutritional
status as reflected in albumin. However, this should be controlled for by the
control group, which is just transgender patients who haven’t taken hormones
previously.
Another
consideration is that body composition changes in transgender patients such
that transgender women lose lean mass and have an increase in body fat percent3.
Although this could affect the metabolic profile (which it didn’t in our study),
changes in fat percent don’t explain altered albumin levels.
Albumin
levels are also low in patients with chronic liver disease, but this would be
inconsistent with the patients’ medical history or other lab results. Frank nephrotic
syndrome is unlikely as there were no reports of this disease within our population,
but we did not have data on urinalysis, so we can’t say for certain.
One study
did show that males (TW baseline equivalent) have higher albumin than females
at younger ages (<60 y.o.) that equilibrates in later decades4.
This sex-specific difference shows how estradiol decreases albumin to cisgender
female levels. However, the reverse effect (increased albumin) does not occur
with testosterone in transgender males. This demonstrates how sex-specific
reference intervals cannot be simply reversed for transgender patients.
In a
normal set of outpatients in the UK, oral contraception use (which includes
estradiol) in women decreased their albumin levels by 0.2 g/dL, which is a
smaller magnitude than found in our study, but supports a hormonal basis for
sex-specific differences in albumin4.
Although
the decrease in albumin for our cohort was not clinically significant (did not
pass lower limit of normal albumin reference interval), it would be important
to monitor albumin levels in older or elderly transgender females on hormone
therapy. Elderly patients are at increased risk of hypoalbuminemia, especially
when hospitalized5.
Summary:
Albumin
is decreased in transgender women taking estradiol therapy.
Albumin
levels do not fall below normal ranges.
This
could be more important in older or elderly transgender patients who are
already at risk of hypoalbuminemia.
References
SoRelle
JA, Jiao R, Gao E et al. Impact of Hormone Therapy on Laboratory Values in
Transgender Patients. Clin Chem.
2019; 65(1): 170-179.
Diemer EW, Grant JD, Munn-Chernoff
MA et al. Gender Identity, Sexual
Orientation, and Eating-Related Pathology in a National Sample of College
Students. J Adolesc Health. 2015;
57(2):144-9.
Auer
MK, Cecil A, Roepke Y et al. 12-months metabolic changes among gender dysphoric
individuals under cross-sex hormone treatment: a targeted metabolomics study. Sci Rep. 2016; 6: 37005.
Weaving
G, Batstone GF, Jones RG. Age and sex variation in serum
albumin concentration: an observational study. Annals of Clinical Biochemistry 2016, Vol. 53(1) 106–111.
Cabrerizo
S, Cuadras D, Gomez-Busto F et al. Serum albumin and health in older people:
Review and meta analysis. Maturitas.
2015; 81(1):17-27.
-Jeff SoRelle, MD is a Molecular Genetic Pathology fellow at the University of Texas Southwestern Medical Center in Dallas, TX. His clinical research interests include understanding how the lab intersects with transgender healthcare and advancing quality in molecular diagnostics.
A female in her 60s with no significant past medical history presented to the emergency department with continued abnormal uterine bleeding for the past two months. She reported never entering menopause. Patient complained of recent unintentional weight loss, shortness of breath, urinary frequency, and new-onset night-time fever and severe fatigue. Physical exam was notable for large uterus and left lower quadrant abdominal tenderness on palpation. Sterile speculum exam revealed a friable tissue extruding from the uterus and malodorous mixture of thin white purulent discharge and blood. Endometrial biopsy, tissue and blood cultures were collected. Labs were notable for normocytic anemia and leukocytosis. Urine analysis was suggestive of urinary tract infection. Pelvic ultrasound showed an enlarged uterus, thickened endometrium with mixed echogenicity. The patient was admitted to the hospital for work up of potential gynecological malignancy and was started on empiric antibiotic therapy for possible urinary tract infection.
The patient’s tissue Gram stain was notable for 2+ WBCs (PMNs) and 4+ gram negative rods. The predominant organism grew on 5% sheep blood and chocolate agars but there was no growth on the MacConkey agar (Image 1).
Image 1. Pasteurella multocida grows on blood (A) and chocolate (B) agar plate. Image 2. Gross cross section of the friable fungating endometrial lesion. (A) Microscopic pathological findings consistent with undifferentiated carcinoma. (B)
Discussion
The predominant organism was identified by MALDI-TOF MS as Pasteurella multocida. Given the microbiological findings, patient was further questioned but she denied having pet at home or contact with animals. The patient underwent a surgery to remove her uterus, both ovaries and Fallopian tubes. The gross pathological examination of her uterus revealed an exophytic endometrial lesion with extensive area of necrosis surrounding the lesion (Image 2A). Final microscopic pathological diagnosis was significant for a highly malignant and invasive tumor of the uterus (Image 2B) and active infection of her left Fallopian tube.
Here we present a rare case of a P. multocida intrauterine infection lacking history of animal exposure in the context of gynecologic malignancy. P. multocida is a small, non-motile, non-spore forming, aerobic and facultative anaerobic gram negative coccobacillus that is associated with animal exposure. [1] This organism is found in the digestive and respiratory tract of domesticated animals (cats, dogs, cattle, sheep etc.) as well as wild animals (lions, buffaloes, panthers etc.). The suggested hypothesis for transmission of Pasteurella to human involves close contact with the infected animal’s oral cavity. Thus, the most likely route of infection in humans is through direct animal bites or scratch, depositing the bacteria on compromised skin or if an infected animal lick on an exposed human mucosal surface [1, 2]. In the general population, P. multocida causes local infection that may progress to abscess formation, but bacteremia is uncommon. However, elderly patients and those with associated immunosuppressed states from chronic disease or cancer are at higher risk of more complicated severe infections [2].
The
presented case highlights the importance of clinical microbiology in the
setting of obtaining detailed history and conducting physical examination. Uncommon cases of P. multocida infection secondary to pet scratches or bite inducing
genital infection and causing tubo-ovarian abscess have been reported. Similarly,
rare cases of immune-compromised P.
multocida bacteremia without history of animal contact have been described.
The most likely explanation is the re-activation of previously asymptomatic
colonization of the respiratory and gastrointestinal tract in the context of
immunosuppression. As such, patients presenting with systemic Pasteurella infection without a
documented animal exposure should undergo extensive evaluation in order to
exclude the presence of an underlying immunodeficiency [1, 3-4].
References
Weber DJ., Wolfson JS., Swartz MN., Hooper DC. Pasteurella multocida infections – report of 34 cases and review of literature. Medicine. 1984;63(3):133-54.
Raffi F, Barrier J, Baron D, Drugeon HB, Nicolas F, Courtieu AL. Pasteurella multocida bacteremia- report of 13 cases over 12 years and review of the literature. Scand J Infecti Dis. 1987; 19:385-93.
Kimura K., Hagiya H., Yamamoto N., Yoshida H., Akeda Y., Nishi I., Tomono K. Pasteurella multocida multiple intrapelvic abscesses in a young woman with uterine cervical cancer. J Infect Chemother (2018).
Lukban JC., Baker MS. Pasteurella multocida isolation from a tuboovarian abscess. A case report. J Reprod Med 1995;40:603-5.
– Pouya Jamshidi, MD is a 1st year anatomic pathology resident at University of Chicago (NorthShore). Academically, Pouya has a particular interest in neuropathology and cellular basis of neuroplasticity. In his spare time, Pouya enjoys listening to classical music and opera.
-Erin McElvania, PhD, D(ABMM), is the Director of Clinical Microbiology NorthShore University Health System in Evanston, Illinois. Follow Dr. McElvania on twitter @E-McElvania.
Specimen handling and transport is a vital training topic in
the realm of Laboratory Safety. There is much to consider here that affects
specimen quality and integrity, and ultimately affects patient results. There are
also considerations involving employee safety at every step of these processes.
One group of employees that can easily be overlooked when it comes to proper
safety training is lab couriers. They perform the important role of properly
and safely transporting specimens for testing, but without the proper education
and tools, these team members can quickly fall into situations of harm.
The courier was running late, and she had one last stop on
her route at a medical office building with multiple physician offices and drop
boxes. It was cold, and she decided to leave the vehicle running while she went
inside to pick up more specimens and deliver lab reports. The car was also left
unlocked. When she came back outside, the car was gone. It was found hours
later in am empty field, but it had been set on fire. There were lab specimens
and reports strewn all over the field and into the nearby woods.
Couriers need to be trained about the importance of their
role, and that training should include information about security and protected
health information (PHI). Be sure to include HIPAA training for all courier
staff. When discussing security, enforce specific processes such as always
turning off vehicles before exiting and properly securing all patient specimens
and any paperwork being transported. Whether couriers use company vehicles or
their own personal transportation for the job, making sure harm does not come
to the vehicle nor any contents being transported is key.
The courier knew he had a long drive ahead of him because of
the toll bridge, and he had several specimens that needed to be delivered as
frozen. He went to the lab’s cooler and scooped a large pile of the dry ice into
a big box using his hands. It was cold, but it helped to wake him up a bit. He
placed the specimens in the box and placed it in the back seta of his vehicle. It
wasn’t very warm out, so as he began his drive, the courier made sure the heat
was on high and that all windows were closed. After a few miles, the courier began
to fell very tired. He struggled to stay awake, and he couldn’t figure out why.
After sitting in traffic on the bridge for a time, he pulled off the road and
called the dispatcher to let them know he could not continue. When he got out
of his vehicle, he began to feel better.
CAP regulations require that laboratory staff have dry ice
safety training, but that requirement extends to anyone who may acquire the
dangerous substance in the lab. Make sure staff are aware of the need for
proper PPE use when handling dry ice. Insulated gloves, the use of a scoop or
tongs, and face protection are necessary when scooping ice into a container.
Couriers should carry no more than three pounds of dry ice in a vehicle, and
there should always be adequate ventilation, including open windows in the
vehicle when transporting dry ice. Dry ice converts rapidly from a solid state
to a gas, and that gas rapidly displaces oxygen in the air making it difficult
to breathe or stay conscious. High volumes of dry ice in a car can create a
very deadly road situation in a short amount of time.
The courier was transporting pathology specimens in a
cooler, but was unaware that the lid had popped off of one of the specimens and
formaldehyde was splashing all over the inside of the cooler. As time went by,
the courier began to feel queasy. After realizing that something did not smell
right in the vehicle, she eventually stopped the van and pulled to the side of
the road to investigate. She opened the cooler and quickly pulled out dripping
specimens and set them on the carpet before feeling too sick to continue
cleaning up the mess. She had to be taken to the Emergency Room for
formaldehyde exposure symptoms while the Lab safety Officer had to bring spill
clean-up supplies to the van to neutralize the formaldehyde. The carpet had to
be removed and disposed of properly.
Courier vehicles need to be equipped with spill clean up
supplies that can handle whatever types of spills could occur during transport.
If formaldehyde is transported, couriers need training in the proper transport
and clean up of that chemical. Biological spill kits should be available as
well, and spill training should be a regular part of overall courier safety
training.
I wish I could say that these were imaginary stories, but
sadly, that is not the case. The stories, though, illustrate clearly what can happen
when proper safety management and training are lacking. Every part of the laboratory
pre-analytical process is important, and every lab team member involved in the
process needs to be considered. Employ complete safety training, and assess safety
competency on a regular basis. By providing the proper tools and safety
training to couriers, you can ensure the quality of lab results, and you can prevent
incidents like these with your employees.
–Dan Scungio, MT(ASCP), SLS, CQA (ASQ) has over 25 years experience as a certified medical technologist. Today he is the Laboratory Safety Officer for Sentara Healthcare, a system of seven hospitals and over 20 laboratories and draw sites in the Tidewater area of Virginia. He is also known as Dan the Lab Safety Man, a lab safety consultant, educator, and trainer.
A 65 year old Caucasian male presents with a skin lesion on his right shoulder. Physical examination reveals a 3 .0 cm × 1.5 cm hyperpigmented plaque with mild hyperkeratosis on his right shoulder and multiple scattered erythematous macules and plaques on the trunk and back Skin biopsy reveals involvement by Blastic Plasmacytoid Dendritic Cell Neoplasm (BPDCN). PET scan reveals no extracutaneous involvement.
The patient undergoes CHOP
chemotherapy followed by autologous hematopoietic stem cell transplantation. He is subsequently treated
systemically with lanolidomide,
venetoclax, and idelalisib due to relapses of disease.
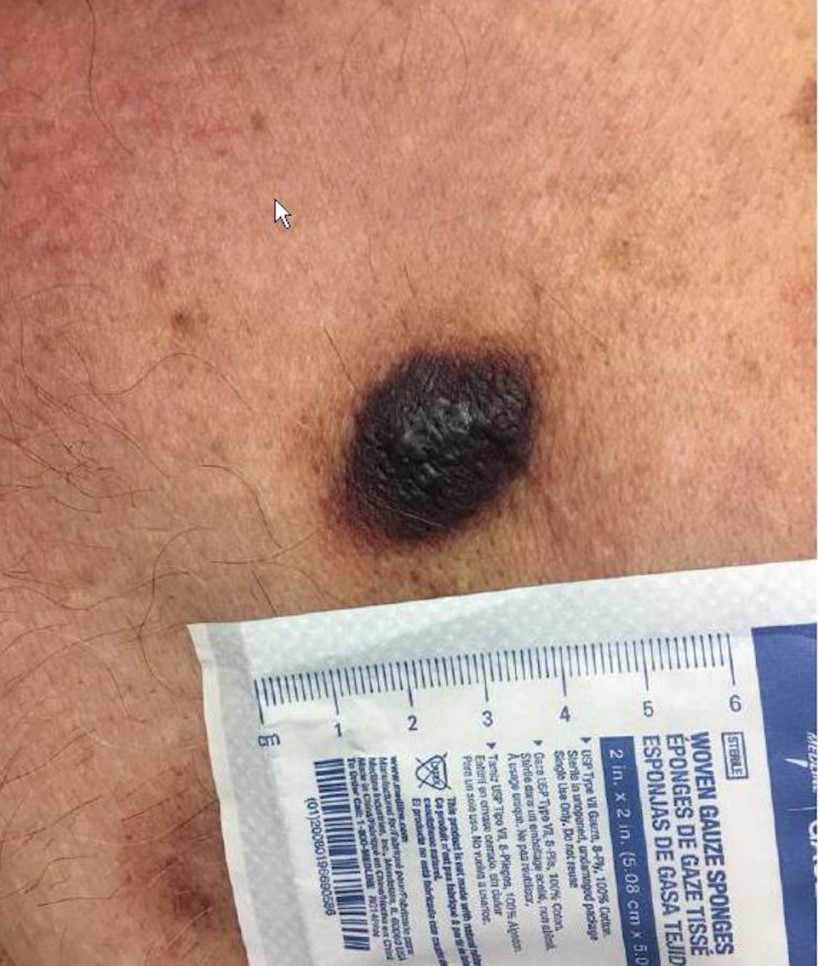
The patient returns to
clinic three years later for follow-up. While his original cutaneous lesions are
completely resolved, new lesions are noted on his back (representative lesion,
Image 1). Hematologic evaluation is remarkable for pancytopenia with hemoglobin
8.7gm/dL, white blood cells 1.4 K/uL, and platelets 39 K/uL. A biopsy of the
bone marrow is performed.
Image 1. Skin lesion on back.
Biopsy Findings
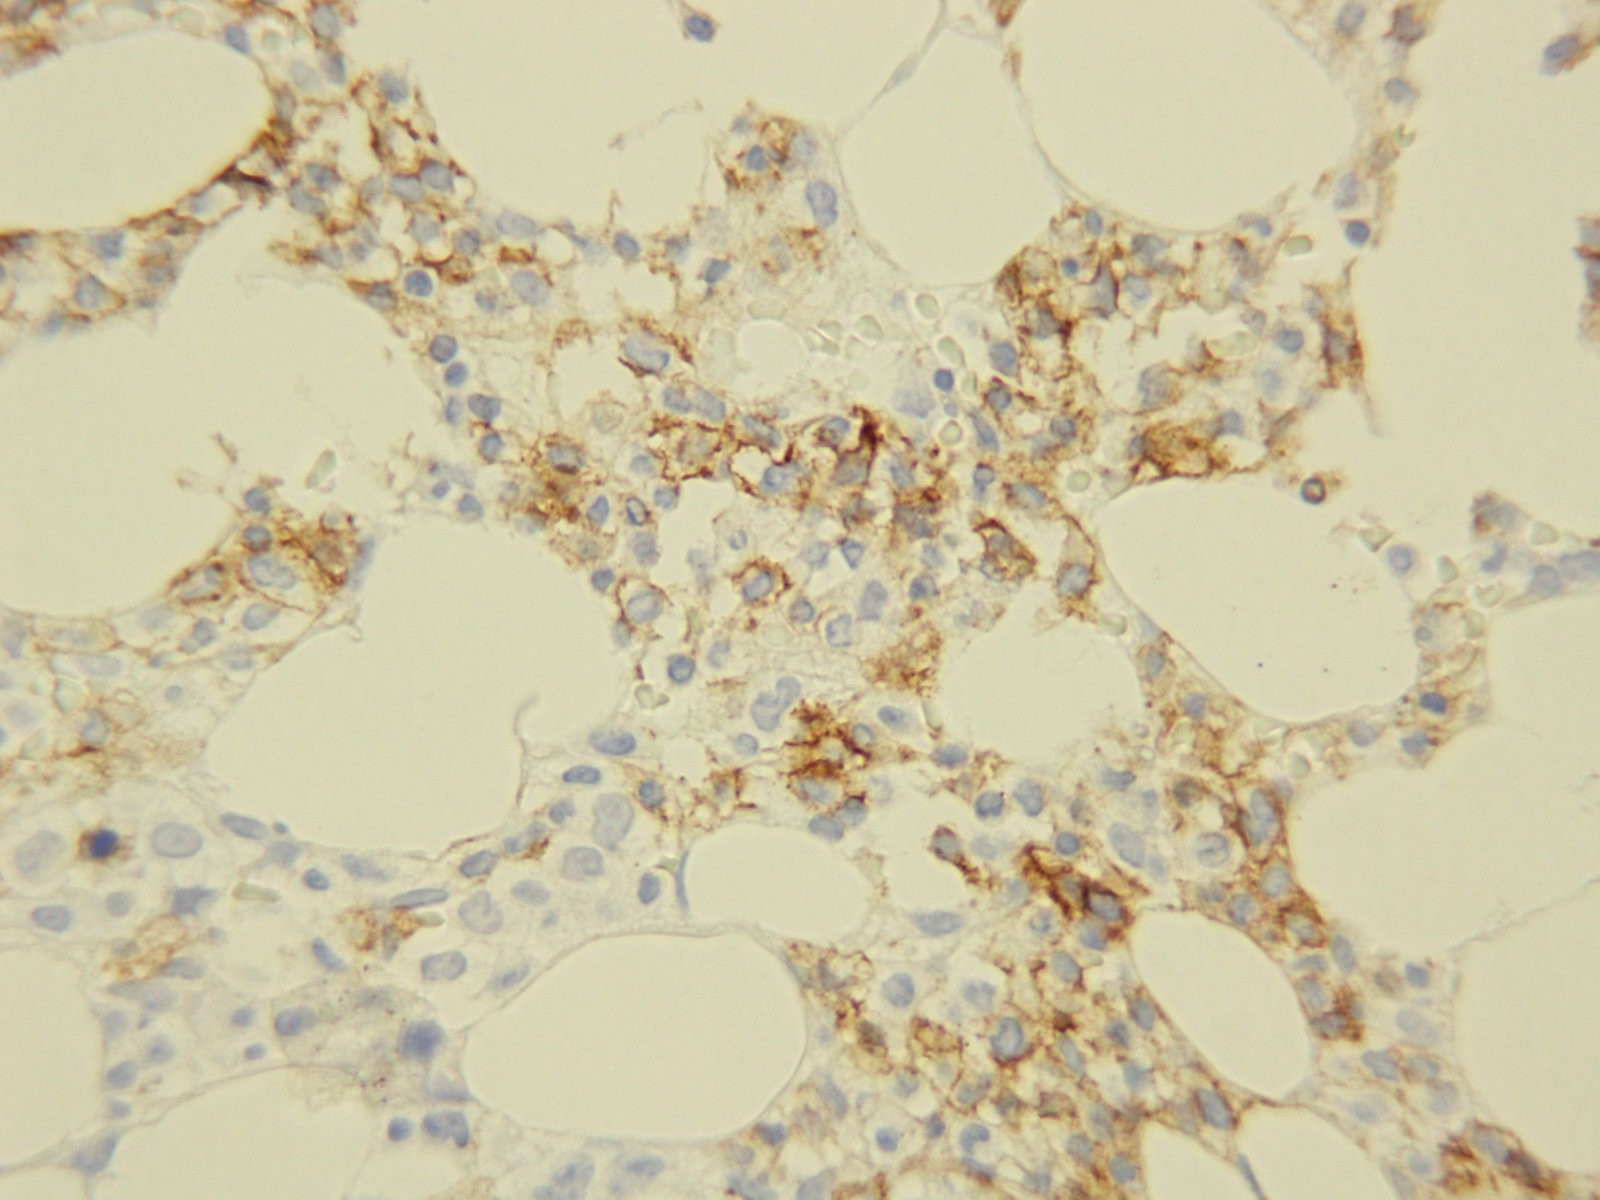
Core biopsyCD56Aspirate
H&E stained sections
demonstrate a normocellular bone marrow with diminished trilineage
hematopoiesis and sheets of amphophilic, blastoid cells with irregular borders
occupying most of the marrow cells. Immunohistochemistry demonstrates a cellular population with CD56. The aspirate smears show similar findings with numerous
clustered blastoid cells (92%) with a monocytoid appearance, often with
basophilic vacuolated cytoplasm. There is also a decrease in myeloid and
erythroid precursors.
Flow cytometric analysis
performed on the bone marrow aspirate reveals a dim CD45 population with
expression of CD4, CD56, partial CD7, dim and partial CD5, and CD38. The same population
lacks expression of immaturity markers such as CD34, MPO, and TdT. The
morphologic and phenotypic findings found in the marrow specimen are diagnostic
of extensive involvement of the marrow by BPDCN.
Discussion
BPDCN is a
rare and highly aggressive malignancy derived
from precursors of
plasmacytoid dendritic cells. Its nomenclature has constantly
changed over years as the understanding of this entity has been improved. It
has been variously known as blastic natural killer cell lymphoma/leukemia, agranular
CD4+ natural killer cell leukemia, and CD4+CD56+haematodermic neoplasm. It is currently classified under acute
myeloid leukemia and related precursor neoplasms in the most recent WHO
classification of tumours of haematopoietic and lymphoid organs.
Limited data exist regarding the incidence of
BPDCN; however, it is estimated to account for 0.7% of primary cutaneous skin
lymphomas and 0.44% of all hematological malignancies. This hematodermic malignancy predominantly
affects elderly male patients with mean age ranging from 60 to 70; however, a
few cases have also been reported in childhood and infancy. As demonstrated in
our case, the patients typically present with multiple
violaceous skin lesions, which may be associate with erythema,
hyperpigmentation, purpura, or ulceration. Extracutaneous involvement is
reported to occur in the bone marrow, peripheral blood, and lymph nodes.
Diagnosis of BPDCN relies on
histological and immunophenotypic findings. Histologically, BPDCN may show a monomorphic
infiltrate of medium-sized immature blastoid cells with round nuclei, finely
dispersed chromatin, and cytoplasmic vacuoles. They typically display immunophenotypic
expression of markers CD4, CD56, CD123, and T-cell leukemia/lymphoma 1 (TCL1) without
any lineage-specific markers of T cells or B cells. Chromosomal
abnormalities involving 5q, 12p,13q, 6q, 15q, and 9p have been reported. The differential diagnosis entails, but is not limited to, mature T-cell lymphoma, nasal-type NK/T-cell lymphoma,
myeloid sarcoma/acute myeloid leukemia and T-cell lymphoblastic lymphoma/leukemia
The clinical course of BPDCN is aggressive, with
a median survival of 9 to 16 months. The patients with disease limited to the
skin may have a better prognosis, while advanced age and advanced clinical
stage are indicators of poor prognosis. There
is currently no consensus on optimal management and treatment because of low
incidence of BPDCN; however, most patients are treated with regimens used for other hematopoietic
malignancies (i.e. CHOP and hyperCVAD) followed by allogeneic stem cell
transplantation for eligible patients. They often respond well to chemotherapy
with complete resolution of skin lesions; however, relapse of disease can occur
due to resistance to chemotherapeutic agents, which may have happened in our
case.
References
Lim
MS, Lemmert K, Enjeti A. Blastic plasmacytoid dendritic cell neoplasm (BPDCN):
a rare entity. BMJ Case Rep.
2016;2016:bcr2015214093.
Grushchak
S, Joy C, Gray A, Opel D, Speiser J, Reserva, Tung R, Smith SE. Novel treatment
of blastic plasmactoid dendritic cell neoplasm: a case report. Medicine (Baltimore). 2017
Dec;96(51):e9452.
Dhariwal
S, Gupta M. A case of blastic plasmacytoid dendritic cell neoplasm with unusual
presentation. Turk J Haematol. 2018
Jul 24. doi: 10.4274/th.2018.0181.
Shi
Y, Wang E. Blastic plasmacytoid dendritic cell neoplasm: a clinicopathologic
review. Arch Pathol Lab Med. 2014
Apr;138(4):564-9.
Bulbul
H, Ozsan N, Hekimgil M, Saydam G, Tobu M. Report on three patients with blastic
plasmactoid dendritic cell neoplasm. Turk
J Haematol. 2018 Sep;35(3):211-212.
Kerr
D 2nd, Sokol L. The advances in therapy of blastic plasmacytoid
dendritic cell neoplasm. Expert Opin
Investig Drugs. 2018 Sep;27(9):733-739.
Pagano
L, Valentini CG, Pulsoi A, Fisogni S, Carluccio P, Mannelli F, et al. Blastic
plasmactoid dendritic cell neoplasm with leukemic presentation: an Italian
multicenter study. Haematologic. 2013
Feb;98(2):239-246.
-Jasmine Saleh, MD MPH is a pathology resident at Loyola University Medical Center with an interest in dermatopathology and hematopathology. Follow Dr. Saleh on Twitter @JasmineSaleh.
-Kamran M. Mirza, MD PhD is an Assistant Professor of Pathology and Medical Director of Molecular Pathology at Loyola University Medical Center. He was a top 5 honoree in ASCP’s Forty Under 40 2017. Follow Dr. Mirza on twitter @kmirza.
The turn of the year is a quasi-inspiring time for many
people who attempt to change something about themselves or their situation with
“New Year’s Resolutions.” When my friends and I were heading to brunch on New
Year’s Day in southern California, there were many people running (alone or in
groups) which I hadn’t seen before and my one thought was, “How long will that
last?” When I returned to Chicago after the holidays, I dusted off my gym
membership card and logged some treadmill time—my one thought was, “I hope this
lasts!” But we are all too familiar with the breaking of these resolutions by
most of us, and the ultimate regret we feel in the latter part of the year when
our hopes and dreams of thinness/money/power/rare pokemon/fame have been dashed
by the collision with our actual lives and the limited time we have to get done
what needs to be done. Fortunately, we are human beings and we are allowed to
be disappointed with ourselves over this (or these) tiny failings as long as
our life trajectory is heading the way we want*. Then there are those handful
of people that each of us will ultimately know who stick to their resolution
and shed the weight, get a new job, or (hopefully with increasing numbers!)
quit smoking! And we are more inspired by their actual doing of these things
than by our lack of resolve.
As individuals, this trivial annual mindset is acceptable and even entertaining. But as a society, empty promises and feigned changes are simply unacceptable. To certain things, we must as a society—and as individuals in that society—commit. Recycling, for example, is a strategy that is both an economic and environmental boon. But as of January 2018, our major “solution” for plastics (especially from the West) that was China has now ended. Other nations willing to take these recyclables stopped their acceptance as well towards the end of 2018. What can we do to solve (not resolve) this situation permanently? Each country should consider first the role of plastics in their society and perhaps, like many African nations, simply ban the product(s). Secondly, encouraging personal recycling and reuse of plastics, for example through water filters to refill plastic bottles or fees on reusable grocery bags, can minimize impact. But, ultimately, each nation needs a sustainable recycling plan that represents a balance of production and utilization, creating a negative plastic total impact (i.e., no new plastic created).
In pathology, the theme of recycling is very important for any laboratory but can have major benefits for laboratories in developing nations. Formalin, xylene, alcohol, and paraffin (the four principle reagents for pathology processing), can be recycled using devices or process plans that can have minimal capital costs to set up. Consider that a given country may have shipping challenges such that an order placed today for 10 gallons of neutral buffered formalin may take 6 weeks to 6 months to arrive and cost 3 to 5 times the price in another country. In that setting, recycling formalin is clearly a superior approach and extrapolates to xylene and alcohol. Process approaches to paraffin (e.g., collecting waste paraffin from trimming and lids, using minimized mold sizes, lateral flow to minimize contamination) can optimize the use of the wax and reduce costs. As these four reagents represent core elements to the process, efficient utilization, reuse, and management can keep costs low and processes running. But the laboratory must commit to this process and adhere to it every moment of every day to change patient’s outcomes for the better.
Similarly, core histology equipment (unlike many clinical laboratory machines) is almost indestructible when properly managed and maintained. Laboratories in developed nations may replace this equipment when it is several years to a decade old when the equipment may have another decade (or sometimes two) left of life. Decisions to replace functional equipment are left to the individual laboratory; however, once this process occurs, functional equipment should not be left to collect dust and should be moved to a new location where it can be of value. Every laboratory considering the replacement of older equipment must ask the question, “What is the remaining functional life of this device?” If that number is many years or the often stated 70%, a plan for donation of the equipment is highly suggested. It is this philosophy that inspired the ASCP Center for Global Health program along with many other groups to actively seek out donated, functional equipment and transfer it to nations and colleagues who desperately need it to maintain their pathology services (Do you have equipment for donation? Email us!). This is especially important because the perceived demand for histology equipment in many low-income countries is so low that manufacturers and distributors refuse to become involved with the equipment (especially with trade and tariff barriers standing in the way). But, in truth, the demand is the same per population as in any other country with at least one high volume, functional pathology laboratory needed for every 1 to 3 million people (depending on population age structure and clinical utilization).
As we begin a new year together, reflecting on what we did (and didn’t) do in 2018 and what we can (and should) do in 2019 is an iterative process that can guide us through many decisions. I hope that everyone reading this blog takes a few moments (or even an hour if you can spare it!) to delve into 2018 and really plan for 2019 with true solutions in mind for any challenges you identify. And, lastly, always take some time every day to think outside yourself and even your laboratory to others in your local community or in foreign lands. Consider what little (and big) things you can do that may improve the life of just one person other than yourself and commit to those things.
*If your life trajectory is not going the way you want, consider performing a personal SWOT (strengths, weaknesses, opportunities, threats) analysis and think outside the box about where you are and where you want to be. Don’t be afraid to make life changes or new life choices that give you a better piece of mind and stronger sense of self and self-awareness. A room full of happy people who are self-aware and emotionally intelligent can solve problems at light speed because their personal issues (good or bad) don’t get in the way. So, for 2019, I strongly encourage everyone to consider really solving (not resolving) the problems you perceive in your life so that we can all work together to solve (not resolve) the challenges we face as a society moving into the next decade.
-Dan Milner, MD, MSc, spent 10 years at Harvard where he taught pathology, microbiology, and infectious disease. He began working in Africa in 1997 as a medical student and has built an international reputation as an expert in cerebral malaria. In his current role as Chief Medical officer of ASCP, he leads all PEPFAR activities as well as the Partners for Cancer Diagnosis and Treatment in Africa Initiative.
Welcome back – in my previous blog we discussed how a run is
evaluated on the Ion Torrent instrument. This quarter’s blog will review the
individual specimen results from that run.
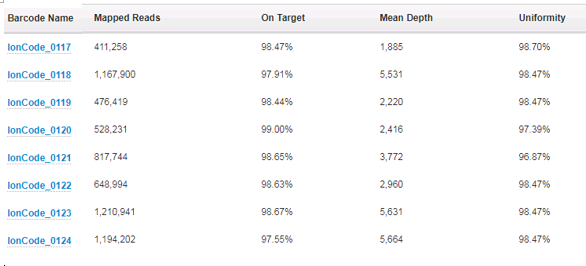
First off, we take a look at how many reads per specimen
have been sequenced and how those reads performed over the areas that are
targeted. For the AmpliSeq Cancer Hotspot Panel v2 that we run, there are a
total of 207 amplicons that are created and sequenced. To assess the depth of
coverage over these amplicons, we need to think about the biology of the tumor
cells and the limit of detection of the assay. We feel confident that we can
detect 5% variant allele frequency for single nucleotide changes, and 10%
variant allele frequency for insertions or deletions. In order to be confident
that we are not missing variants, we require the specimen has a tumor
percentage greater than 20%. This is because, for a given tumor, it can be assumed
that if it is mutated, it will be only heterozygous – only one of the two
alleles will have the variant. This automatically halves the possible allele
frequencies from any given tissue. If a colon specimen that we are given to
test has a tumor percentage of 40%, it can be assumed that any variant will
have a variant allele frequency of no more than 20%. Because of this then, we
also require the amplicons that are sequenced to have at least 500x coverage –
they need to be sequenced at least 500 times so that if we have a 5% mutation,
we will see it in 25 of the reads and we can feel confident this is an actual
change, as opposed to background noise.
Next, we look at the On Target percentage and Uniformity
percentage (over 95% for each is expected). The On Target value tells us what
fraction of the amplicons actually cover the 207 amplicons that are in the
panel. Uniformity informs us of how even the number of reads is over all the
207 amplicons – were they all equally represented or were there a subset of
these that had more coverage than the others? This information can actually
lead us to further testing – if there is a subset of amplicons that have more
coverage than the rest, and it they are all from one gene, this may indicate
gene amplification. In these cases, the clinician is alerted and additional
testing can confirm the amplification.
All of this coverage information is provided by one of the
“plugins” we run after the basecalling and alignment are finished:
The most useful (and interesting!) information is gathered
from the variant calling plugin. This plugin compares the specimen sequences
with the reference sequences and reports the differences – the “variants”. Many
of the variants that are detected are single nucleotide polymorphisms (variants
that are detected in greater than 1% of the population). They could also be
known artifacts of the sequencing itself. These are all analyzed and
categorized in the validation of the assay and then can be filtered out when
analyzing clinical data. After filtering out the known SNPs and artifacts, the
somatic changes can then be evaluated. Generally, the panel will detect 15-20
variants, but after filtering only 1-4 variants will be somatic changes. Each
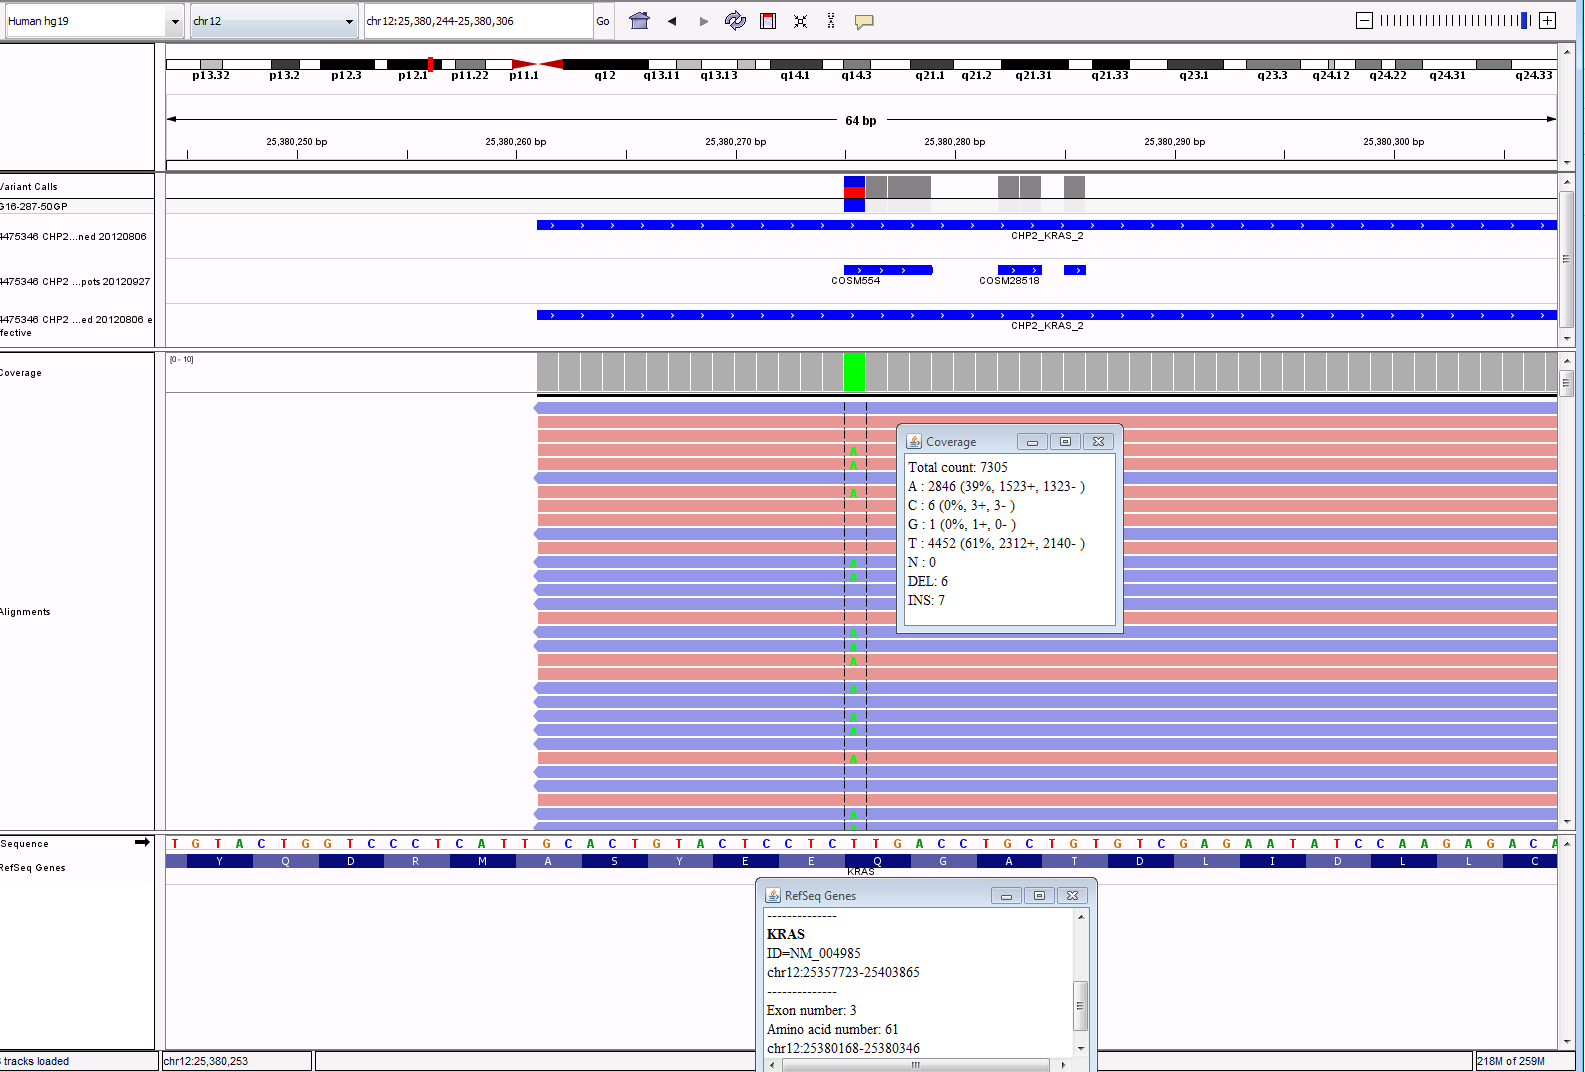
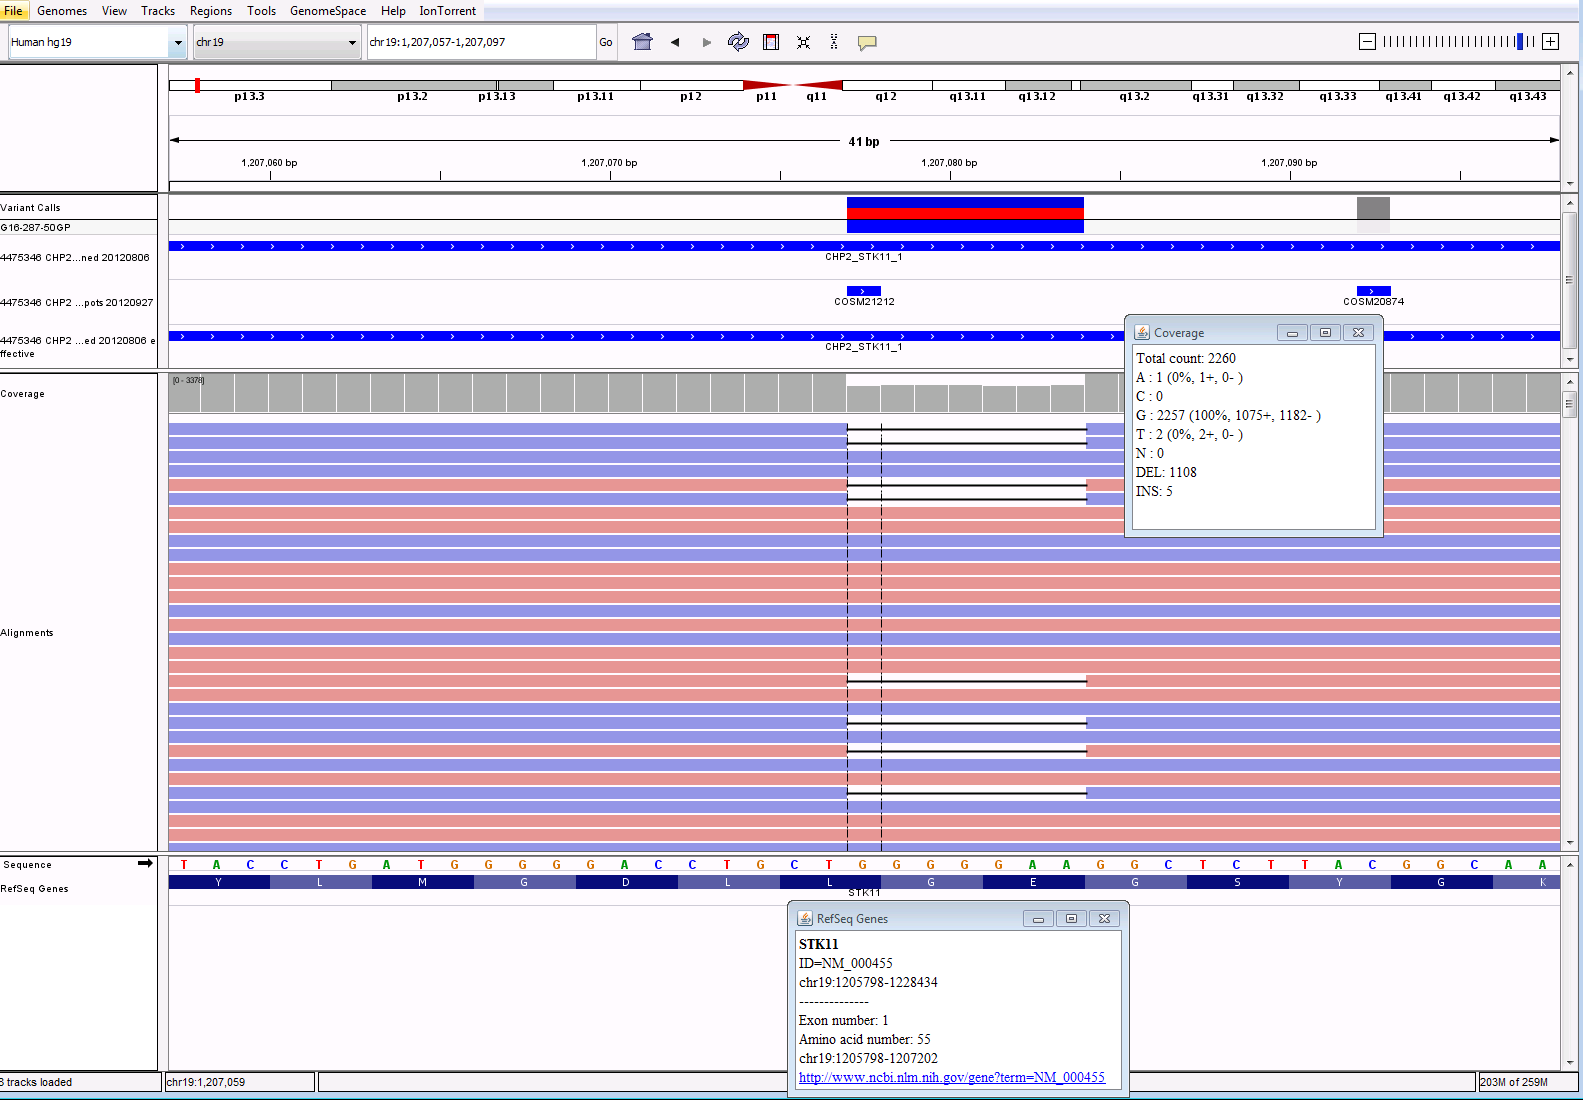
change that is detected is reviewed using a program called IGV, shown below. We
compare the sequence to confirm that what the plugin is reporting looks correct
in the actual reads from the sequencer. See screenshots below of a subset of
variants called, then filtered, and analyzed in IGV. While the plugin is
exceptionally good at variant calling, no program is perfect and visualizing
the data is still necessary to confirm there is not anything else going on in
the area that is sequenced. The fastq file from the run is also run through a
secondary software to compare results. The variants for each specimen are
assessed for variant allele frequency, coverage and quality in both software.
VariantCaller Output
Filtered
Calls: White cells means
SNP, Blue cells mean possible somatic call
IGV Output for KRAS
and STK11 calls:
Lastly, the results are brought into yet another software to
be reported. This software will allow the pathologists to assign significance
to the variants. It will also pull in any treatment information linked to the
variants and then allow the pathologist to pick any applicable clinical trials
in order to assist the clinician as much as possible. In future blogs we will
take a look at cases like this to see interesting findings of oncology cases.
-Sharleen Rapp, BS, MB (ASCP)CM is a Molecular Diagnostics Coordinator in the Molecular Diagnostics Laboratory at Nebraska Medicine.