Welcome back – in my previous blog we discussed how a run is evaluated on the Ion Torrent instrument. This quarter’s blog will review the individual specimen results from that run.
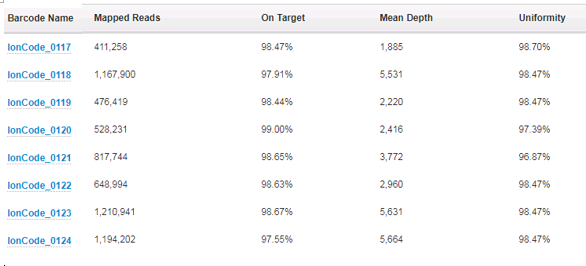
First off, we take a look at how many reads per specimen have been sequenced and how those reads performed over the areas that are targeted. For the AmpliSeq Cancer Hotspot Panel v2 that we run, there are a total of 207 amplicons that are created and sequenced. To assess the depth of coverage over these amplicons, we need to think about the biology of the tumor cells and the limit of detection of the assay. We feel confident that we can detect 5% variant allele frequency for single nucleotide changes, and 10% variant allele frequency for insertions or deletions. In order to be confident that we are not missing variants, we require the specimen has a tumor percentage greater than 20%. This is because, for a given tumor, it can be assumed that if it is mutated, it will be only heterozygous – only one of the two alleles will have the variant. This automatically halves the possible allele frequencies from any given tissue. If a colon specimen that we are given to test has a tumor percentage of 40%, it can be assumed that any variant will have a variant allele frequency of no more than 20%. Because of this then, we also require the amplicons that are sequenced to have at least 500x coverage – they need to be sequenced at least 500 times so that if we have a 5% mutation, we will see it in 25 of the reads and we can feel confident this is an actual change, as opposed to background noise.
Next, we look at the On Target percentage and Uniformity percentage (over 95% for each is expected). The On Target value tells us what fraction of the amplicons actually cover the 207 amplicons that are in the panel. Uniformity informs us of how even the number of reads is over all the 207 amplicons – were they all equally represented or were there a subset of these that had more coverage than the others? This information can actually lead us to further testing – if there is a subset of amplicons that have more coverage than the rest, and it they are all from one gene, this may indicate gene amplification. In these cases, the clinician is alerted and additional testing can confirm the amplification.
All of this coverage information is provided by one of the “plugins” we run after the basecalling and alignment are finished:
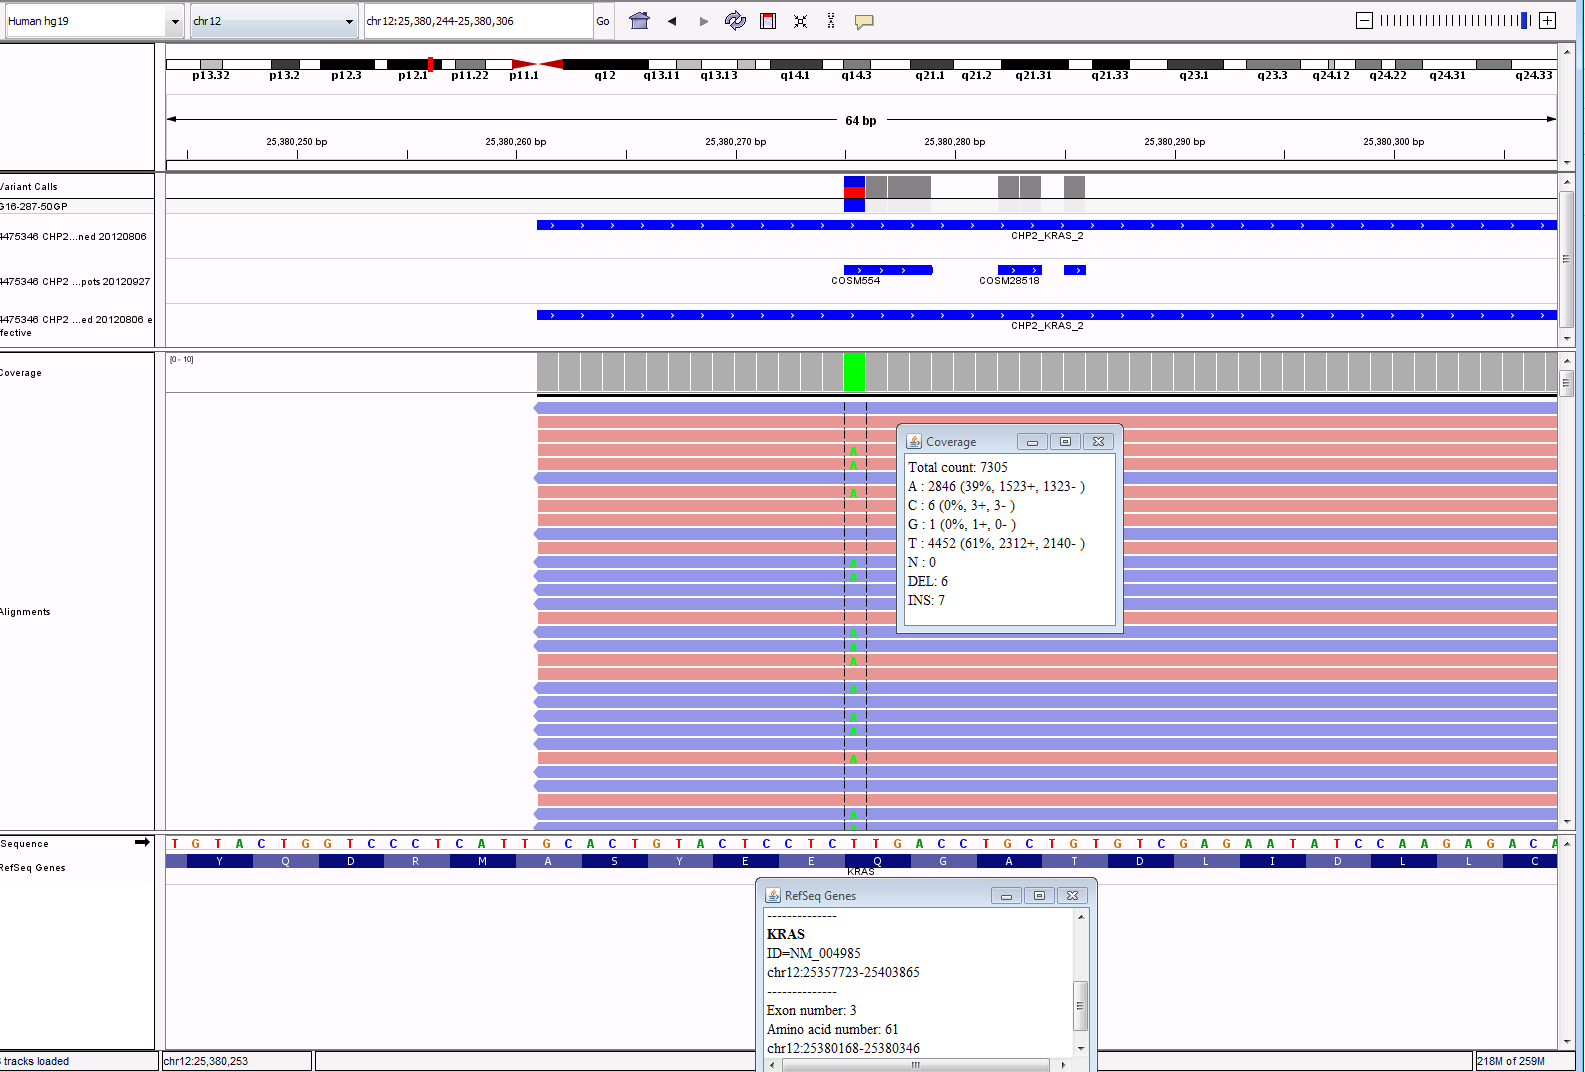
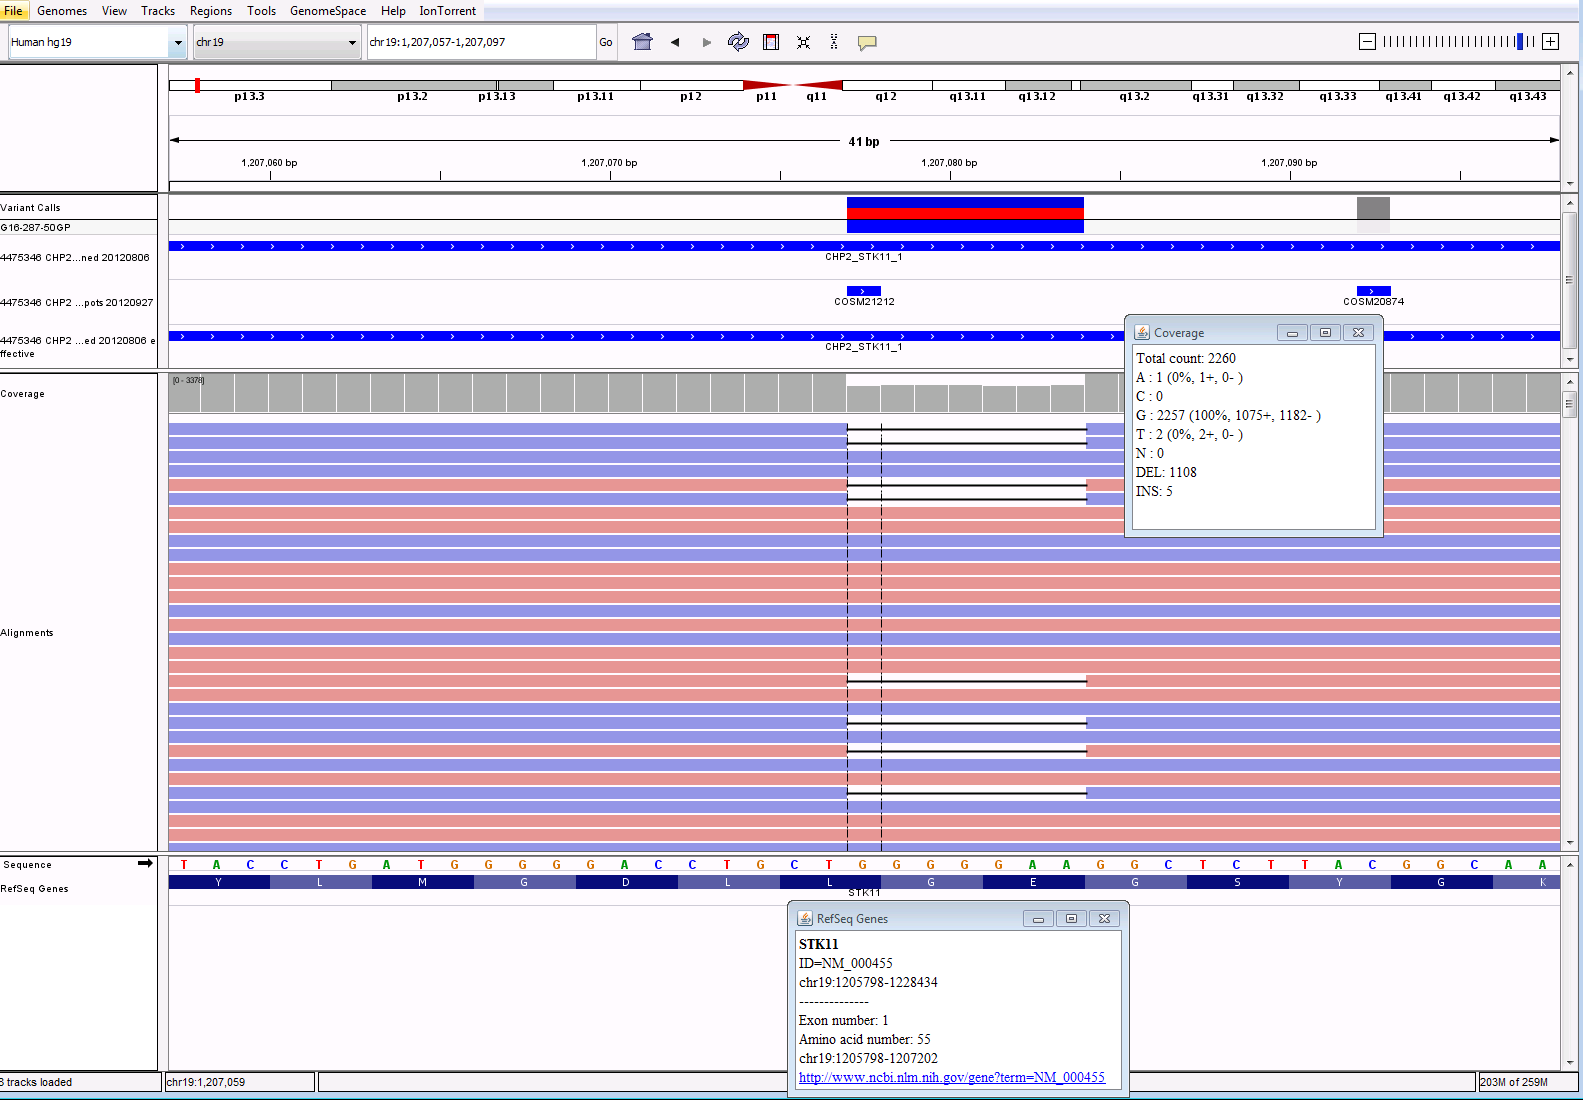
The most useful (and interesting!) information is gathered from the variant calling plugin. This plugin compares the specimen sequences with the reference sequences and reports the differences – the “variants”. Many of the variants that are detected are single nucleotide polymorphisms (variants that are detected in greater than 1% of the population). They could also be known artifacts of the sequencing itself. These are all analyzed and categorized in the validation of the assay and then can be filtered out when analyzing clinical data. After filtering out the known SNPs and artifacts, the somatic changes can then be evaluated. Generally, the panel will detect 15-20 variants, but after filtering only 1-4 variants will be somatic changes. Each change that is detected is reviewed using a program called IGV, shown below. We compare the sequence to confirm that what the plugin is reporting looks correct in the actual reads from the sequencer. See screenshots below of a subset of variants called, then filtered, and analyzed in IGV. While the plugin is exceptionally good at variant calling, no program is perfect and visualizing the data is still necessary to confirm there is not anything else going on in the area that is sequenced. The fastq file from the run is also run through a secondary software to compare results. The variants for each specimen are assessed for variant allele frequency, coverage and quality in both software.
VariantCaller Output

Filtered Calls: White cells means SNP, Blue cells mean possible somatic call

IGV Output for KRAS and STK11 calls:
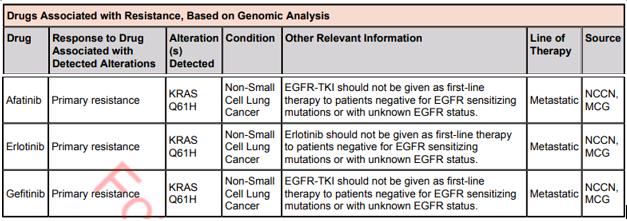
Lastly, the results are brought into yet another software to be reported. This software will allow the pathologists to assign significance to the variants. It will also pull in any treatment information linked to the variants and then allow the pathologist to pick any applicable clinical trials in order to assist the clinician as much as possible. In future blogs we will take a look at cases like this to see interesting findings of oncology cases.


-Sharleen Rapp, BS, MB (ASCP)CM is a Molecular Diagnostics Coordinator in the Molecular Diagnostics Laboratory at Nebraska Medicine.
