Hematopathology Case Study: A 45 Year Old Man with Cytopenias and High Ferritin

Case history

A 45 year-old man presented with vomiting and diarrhea for 5 days. Laboratory studies demonstrated anemia and thrombocytopenia, an elevated ferritin level (23,772 ug/L) and methemoglobinemia. Chest roentgenography revealed cardiomegaly. A follow-up ECHO showed a desreased ejection fraction of 15%. Work-up confirmed viral myocarditis and G6PD deficiency as the cause of the cardiac findings and methemoglobinemia respectively. His clinical condition deteriorated despite therapy: he developed acute kidney and liver failure and had worsening cytopenias. A bone marrow biopsy was performed.

Histomorphological findings

image-121
Bone marrow aspirate smear (100x)
BM17-228 HLH 100x-2
Bone marrow aspirate smear (100x)
CPC Core biopsy 20x
Bone marrow core biopsy (H&E, 20x)
CPC Core biopsy 40x
Bone marrow core biopsy (H&E, 40x)
CPC Core biopsy 100x
Bone marrow core biopsy (H&E, 100x)

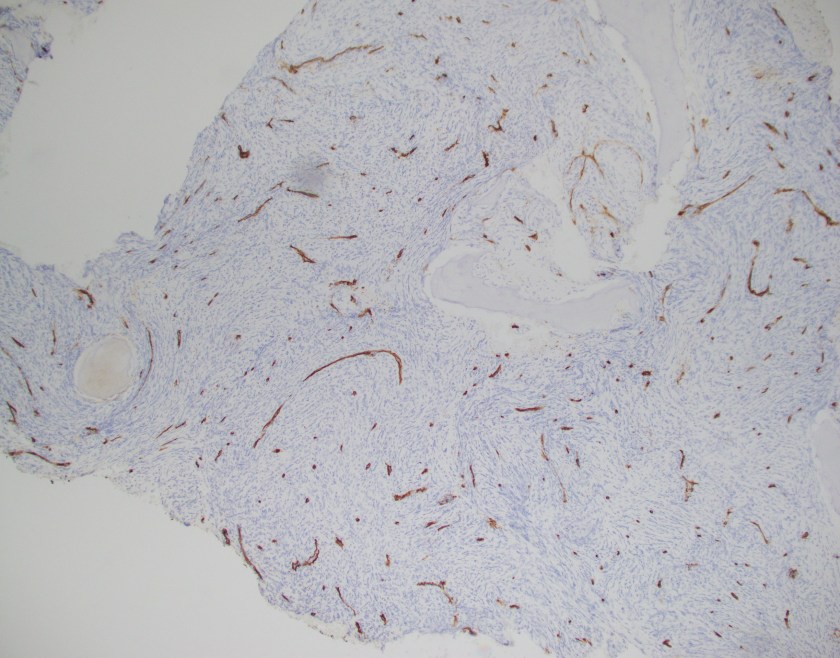
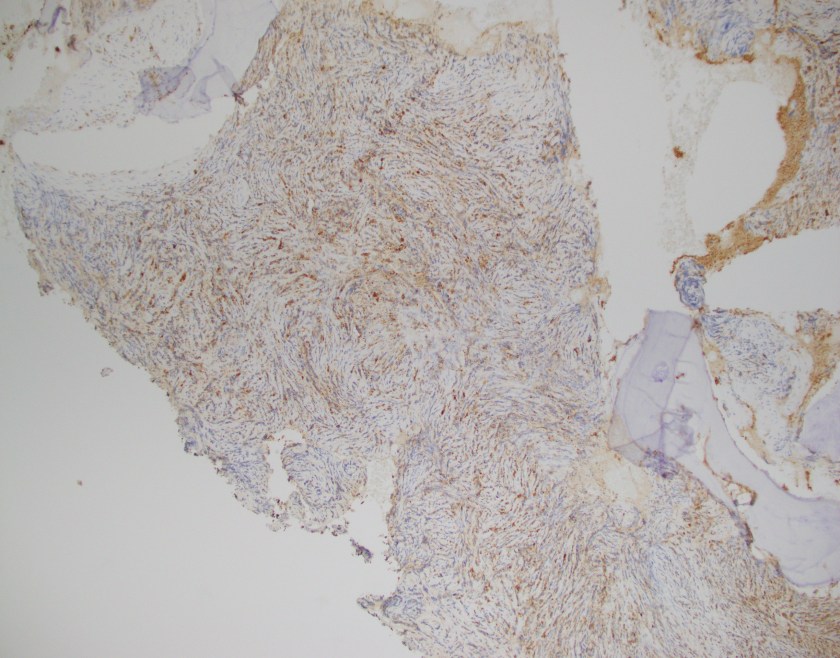
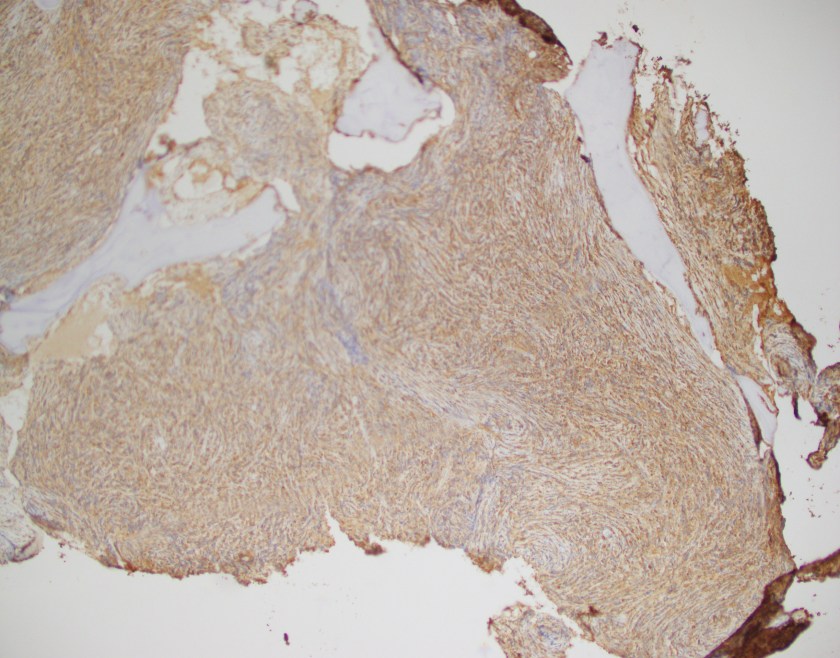
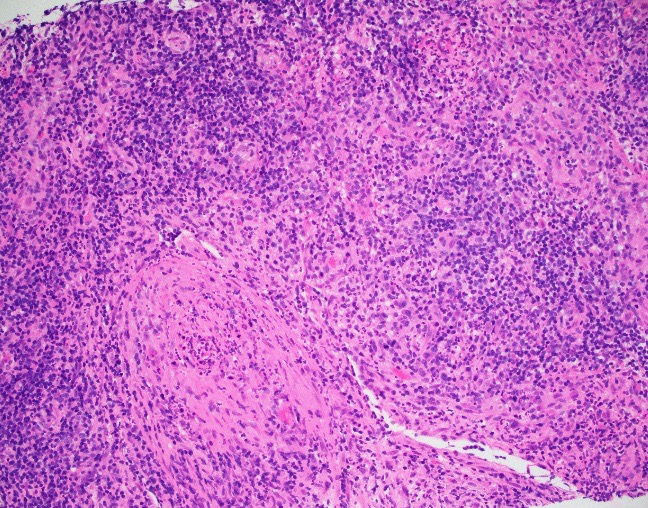
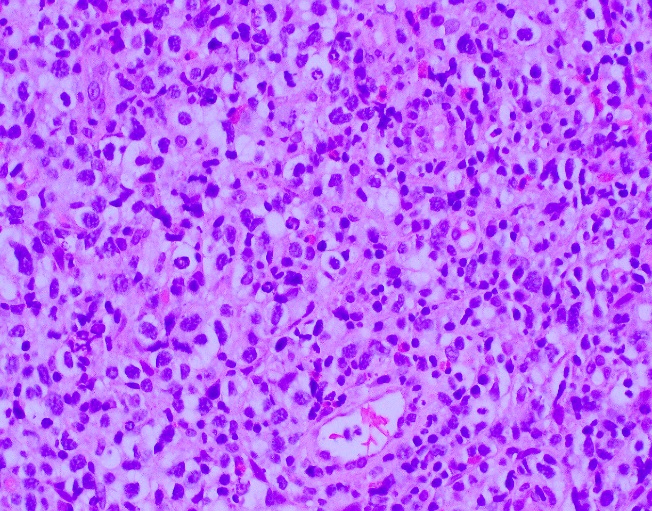
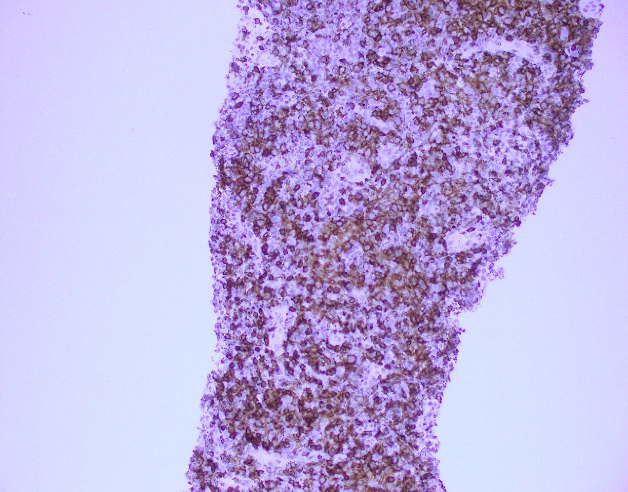
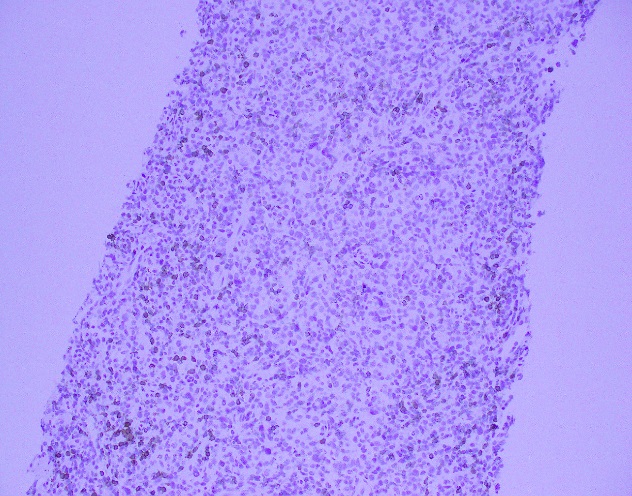
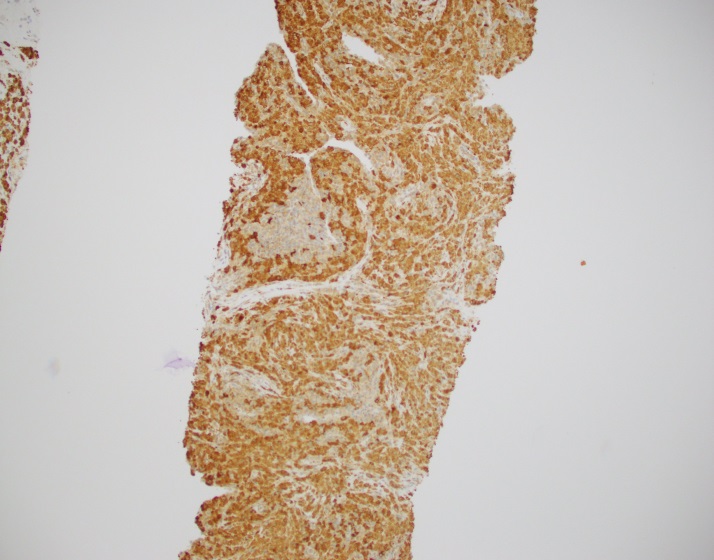
Evaluation of the peripheral blood (not pictured) confirmed a macrocytic anemia with marked anisopoikilocytosis including schistocytes, polychromasia, nucleated red blood cells, absolute neutrophilia, monocytosis and thrombocytopenia. The marrow aspirate smear demonstrated appropriate maturation in all cell lines. Scattered hemophagocytic histiocytes (pictured above) were noted. The bone core biopsy was high-normocellular for age with progressive trilineage hematopoeisis. Scattered histiocytes with internalized erythroid cells and debris were visualized. There was no increase in blasts. Flow cytometry analysis performed on the bone marrow aspirate did not show a significant increase in blast population. Gating on the lymphocytes did not show a B-cell monoclonal population or T-cell abnormality by markers assayed.

Diagnosis

High-normocellular marrow with progressive trilineage hematopoeisis and prominent hemophagocytic histiocytes.

Overall the patient met the clinical criteria (see below) for Hemophagocytic Lymphohistiocytosis (HLH); with fever (≥38.5 C), splenomegaly, bicytopenia, presence of hemophagocytic histiocytes in bone marrow and high ferritin level (>500ng/mL).

A clinical diagnosis of HLH was rendered.

Discussion

HLH is an uncommon hematologic disorder that is often fatal.  The underlying pathogenesis involves an exaggerated but ineffective inflammatory response of excessive macrophage and T-cell activation, and impairment of natural killer (NK) and cytotoxic T-cell function. HLH has familial and acquired forms. Secondary, or acquired HLH can be associated with infections (especially viral etiologies), underlying malignancy (particularly lymphomas and leukemias), and medications used for systemic lupus erythematosus. Clinically, autoimmune disease-associated HLH overlaps significantly with macrophage activation syndrome (MAS).

HLH is a clinical diagnosis that can be established with molecular testing or by meeting five of eight clinical and laboratory diagnostic criteria according to the HLH-2004 guidelines.

HLH-2004: Revised diagnostic guidelines for HLH10

The diagnosis HLH can be established if one of the two criteria below is met:

  1. A molecular diagnosis consistent with HLH (i.e., reported mutations found in either PRF1 or MUNC13-4); or
  2. Diagnostic criteria for HLH are fulfilled (i.e., at least five of the eight criteria listed below are present:
    • Persistent fever
    • Splenomegaly
    • Cytopenias (affecting ≥2 of 3 lineages in the peripheral blood):
      • Hemoglobin <90g/L (in infants <4 weeks: <100g/L)
      • Platelets <100 x 109/L
      • Neutrophils <1.0 x 10⁹/L
    • Hypertriglyceremia and/or hypofibrinogenemia:
      • Fasting triglycerides ≥3.0 mmol/L (i.e., ≥ 265mg/dl)
      • Fibrinogen ≤1.5 g/L
    • Hemophagocytosis in bone marrow* or spleen or lymph nodes, no evidence of malignancy
    • Serum ferritin ≥ 500µg/L (i.e., 500 ng/ml)
    • Low or absent NK cell activity (according to local laboratory reference)
    • Increased serum sIL2Rα (according to local laboratory reference)

*In hematopathology, the finding of relevance is the presence of hemophagocytic histiocytes in the marrow or other biopsies organs. While debris-laden histiocytes are commonly noted in marrow aspirates, the findings of engulfed erythroid cells is warranted to call a ‘hemophagocytic’ histiocyte.

Often a bone marrow biopsy will be performed in cases where there is clinical suspicion for HLH. This serves to try and visualize the hemophagocytic activity, and to rule out other diseases with similar clinical presentations as HLH. The pathologic evaluation of HLH is tricky, since there is no established criteria for quantitation of hemophagocytic histiocytes in a bone marrow aspirate. Furthermore, hemophagocytosis is not specific to HLH and can be seen in other conditions such as: post-blood transfusion, chemotherapy, sepsis and major operations. Published data shows that the presence of hemophagocytosis has a sensitivity of 83% and a specificity of only 60% in diagnosing HLH.

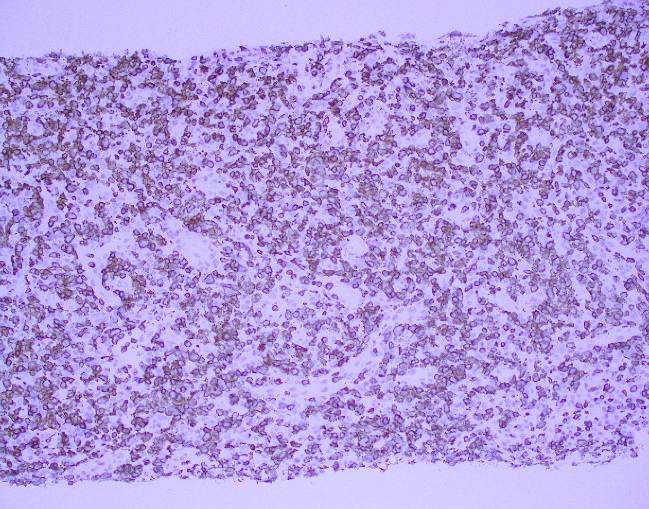
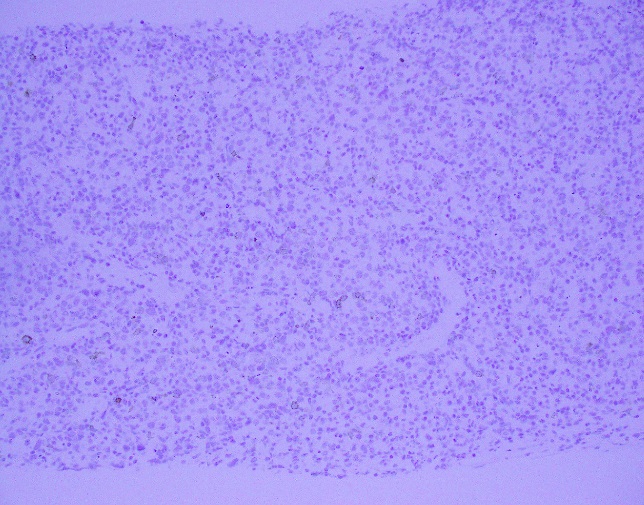
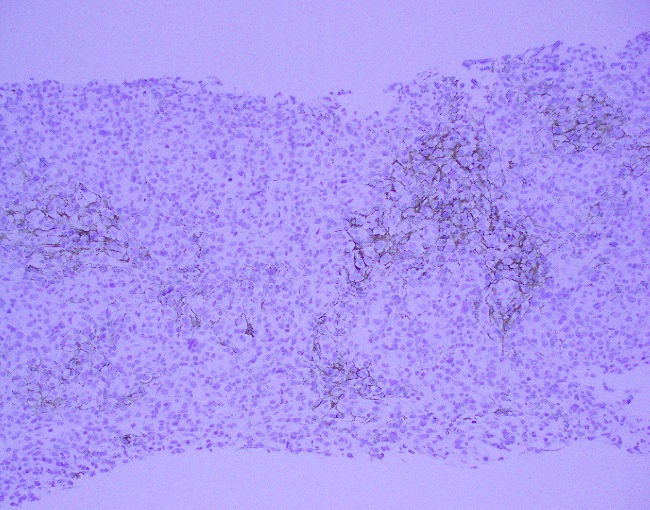
What about immunohistochemical staining for the histiocytes? While IHC can help outline histicoytic cells, unfortunately, quantitation of hemophagocytic histiocytes in the core biopsy or clot sections with the aid of CD68 immunostains does not correlate well with disease probability either.

Overall, the nonspecificity of hemophagocytosis in the marrow, even when present in high amounts, should remind both pathologists and clinicians that an isolated finding of hemophagocytosis lacks specificity and does not necessarily suggest HLH when the clinical presentation and laboratory findings are not compatible with the diagnosis. However, there still remains value in bone marrow biopsy examination in cases where clinical suspicion for HLH is high; in order to exclude other marrow processes; and in the rare case where there may not have been clinical suspicion of HLH but the presence of hemophagocytic histiocytes can raise that differential.

For additional images of hemophagocytic histiocytes check out these amazing picture tweets by Dr. Kate Dannheim (@KDannheimMD) https://twitter.com/KDannheimMD/status/933128799818002432) and Dr. Bharat Ramlal (@BeRaad87): https://twitter.com/HHPathology/status/926087105381531648


References

  1. Ho C, Yao X, Tian L, et al. Marrow Assessment for Hemophagocytic Lymphohistiocytosis Demonstrates Poor Correlation with Disease Probability. Am J Clin Pathol. 2014 Jan;141(1):62-71
  2. Hunter JI et al. HLH-2004: Diagnostic and therapeutic guidelines for hemophagocytic lymphohistiocytosis. Pediatr Blood Cancer. 2007 Feb;48(2):124-31.


AIK

-Ayse Irem Kilic is a 1st year anatomic and clinical pathology resident at Loyola University Medical Center. Follow Dr. Kilic on twitter @iremessa.

Mirza-small

-Kamran M. Mirza, MD PhD is an Assistant Professor of Pathology and Medical Director of Molecular Pathology at Loyola University Medical Center. He was a top 5 honoree in ASCP’s Forty Under 40 2017. Follow Dr. Mirza on twitter @kmirza.

Hematopathology Case Study: A 72 Year Old Female with History of Lung Adenocarcinoma

Case history 

A 72 year-old female with a history of stage IA lung adenocarcinoma diagnosed in 2009 s/p resection underwent a surveillance CT scan of the chest which revealed an enlarged right upper lobe paramediastinal lung nodule. A subsequent MRI of the abdomen and PET scan revealed mediastinal lymphadenopathy with numerous boney lesions. Due to the prior history of lung cancer, a right iliac bone biopsy was performed.

Diagnosis

myesar-he-10
H&E, 10x
myesar-he-20
H&E, 20x
myesar-he-50
H&E, 50x
myesar-cd-45
CD45
myesar-cd-117
CD117
myesar-cd-34
CD34
myesar-cd-68
CD68
myesar-cd-56
CD56
myesar-mpo
MPO
myesar-cd-43
CD43

Sections of bone show an extensive intramedullary infiltration by large cells with moderate amounts of cytoplasm, irregular nuclear contours, moderately condensed chromatin and some cells with inconspicuous nucleoli.

By immunohistochemistry, the neoplastic cells are immunoreactive for CD45, MPO, CD68, CD56, and CD43. The cells are negative for cytokeratins, TTF-1, CD20, CD10, PAX5, BCL6, MUM1 and CD79a. CD3 and CD5 highlight rare scattered T-cells.

Overall, in the context of multiple osseous lesions, these findings are representative for a myeloid sarcoma.

Discussion 

Myeloid sarcoma is a tumor mass consisting of myeloid blasts with or without maturation occurring at any site other than the bone marrow. Infiltration of blasts at any site are not classified as a myeloid sarcoma unless there is effacement of tissue architecture. Frequent sites for involvement by a myeloid sarcoma include skin, lymph node, gastrointestinal tract, bone, soft tissue, and testis.

Detection of a myeloid sarcoma is considered as an equivalent diagnosis of acute myeloid leukemia. It may precede or coincide with AML as well as be a presenting finding in those that relapse from AML.

Morphologically, the blasts may or may not show features of maturation and efface the architecture of the involved site. Immunophenotypically, CD68 is considered the most commonly expressed marker followed by MPO, CD117, lysozyme, CD34, TdT, CD56, CD30, glycophorin and CD4. Interestingly enough, CD123 may be expressed in those cases that also have inv(16). It must be emphasized that those cases that meet criteria for a mixed phenotypic acute leukemia (MPAL) cannot be classified as a myeloid sarcoma.

By cytogenetics, 55% of myeloid sarcomas have aberrant cytogenetic findings including monosomy 7, MLL rearrangements, inv(16), and other chromosomal changes. In the pediatric population, t(8;21) may be observed and is less frequent in adults. NPM1 is mutated in 16% of cases.

Lastly, the differential diagnosis should be kept broad in cases that appear lymphoid in nature yet do not mark appropriately. It is often expressed that the primary morphologic differential is a lymphoma, including lymphoblastic lymphoma, Burkitt lymphoma, diffuse large B-cell lymphoma, blastic plasmacytoid dendritic cell neoplasm, and other small round blue cell tumors of childhood.

Reference

  1. Swerdlow SH, Campo E, Harris NL, et al.  WHO Classification of Tumours of Haematopoietic and Lymphoid Tissues. Lyon, France: IARC Press; 2008


PhillipBlogPic-small

-Phillip Michaels, MD is a board certified anatomic and clinical pathologist who is a current hematopathology fellow at Beth Israel Deaconess Medical Center, Harvard Medical School, Boston, MA. His research interests include molecular profiling of diffuse large B-cell lymphoma as well as pathology resident education, especially in hematopathology and molecular genetic pathology.

Pathologist on Call: There Is No Perfect Lab Test for Smoking Assessment

Cigarette smoking can affect both innate and adaptive immunity, and introduces concerns when evaluating a patient’s eligibility for surgery. It has been shown to hinder time required for healing and long-term survival of patients. It can promote vascular complications, increase the rates of hepatocellular carcinoma and reduce lung function.1 For lung transplantation, one of the common requirements of eligibility is smoking abstinence for at least 6 months. Smoking post-surgery is associated with worse outcomes for the patients including complications and higher rates of mortality.2 Relapse to smoking post lung transplantation has been reported to range from 11% to 23% in various patient populations.3 As a result, clinical testing for cigarette smoking abstinence is an important part of initial workup and follow-up of transplant patients.

In some situations, the burden of lung allocation weighs heavily on a single clinical laboratory result that is perceived to definitively confirm or exclude active cigarette smoking. This subsequently factors into the decision by the physicians to deem the patient eligible to receive a lung transplant. The perception of nicotine testing as definitive proof of smoking is misleading and does not reflect the complexity of situations that can lead to a positive test result.

How can we assess smoking?

Ideally, many factors should weigh into the final smoking status determination including self-reporting (used historically), witnesses to behavior, odor, and past history including cessation attempts. Clinical laboratory testing is important and thought to be more reliable means for smoking assessment. It can involve testing for nicotine (originating from tobacco or nicotine replacement therapy, NRT) and its metabolites: cotinine, 3-hydroxycotinine (3-OH-cotinine), and nornicotine. Moreover, nicotine contains a number of alkaloids that are not usually present in nicotine-replacement therapies (NRTs) including anatabine and anabasine.4 Nicotine testing can involve a combination of metabolites such as cotinine as well as alkaloids like anabasine. Various sample types have been used including saliva, blood and urine.5 In addition, measurements of the exhaled carbon monoxide (CO) have been used to assess recent smoking status (within the last 8 hours).6

Clinical case: patient with detectable nicotine metabolites

A case involving a patient being considered for lung transplantation was received by our department. The patient had been tested for anabasine, nicotine, and its metabolites in urine. Testing of random urine specimens was performed by liquid chromatography tandem mass spectrometry (LC-MS/MS) at different time points from samples collected during hospital visits (days 0, 38, and 62). The urine contained variable concentrations of nicotine and its metabolites, with anabasine concentrations below the detection limit in 2 out of the 3 testing instances. Testing at day 0 showed an interfering substance that prevented the determination of accurate anabasine concentration. The nicotine and its metabolite concentrations in the random urine specimens were lower from day 0 to day 38, but a noticeable increase of 3-OH-cotinine and cotinine concentrations was observed in the specimen collected on day 62. The physician was seeking information about the current smoking status of the patient and was planning to use this information to determine the patient’s lung transplant eligibility.

smoking-1


Days 0 38 62
Analyte concentration (ng/mL)
3-OH-cotinine 4074 89 603
Anabasine interf. subst. < 3 < 3
Cotinine 1404 47 425
Nicotine 241 < 2 72
Nornicotine 58 < 2 6


Figure and table 1. Nicotine, metabolite and anabasine concentrations (ng/mL) at different time points for a patient evaluated for lung transplantation eligibility. Anabasine was not detected on days 38 and 62, with an interfering substance preventing quantitation on day 0.

How definitive are these results?

No information was available regarding self-reported smoking or NRT use history for this patient. The physician had high suspicion that the patient was an active smoker and was attempting to use higher concentrations of nicotine and metabolites observed on day 62 as evidence of recent tobacco use.

For cotinine, values can range from 20-550 ng/mL for daily tobacco use.5 Nicotine concentrations in urine can approach over 5000 ng/mL with daily use. Together, high nicotine and cotinine can support tobacco or high-dose nicotine patch use. Furthermore, presence of nornicotine above 30 ng/mL along with anabasine greater than 10 ng/mL would be consistent with current tobacco use rather than NRT.7

Given that these were random urine specimen and the urinary creatinine values are not routinely measured, it’s important to consider the possible contributions of the variable urine concentration to the analyte concentrations. It has previously been reported that individuals abstaining from smoking for at least two weeks should present with nicotine of <30 ng/mL, cotinine of < 23 ng/mL, 3-OH-cotinine of <120 ng/mL, nornicotine < 3 ng/mL, and anabasine of < 2 ng/mL in urine.7 Based on these cut-offs, all analytes except anabasine would suggest new nicotine intake within the last two weeks.

In general, a positive anabasine result, in combination with the presence of nicotine metabolites, is consistent with active use of a tobacco product, whereas anabasine values of < 2ng/mL may suggest that NRT is the likely source.8 This can imply that the patient is abstinent from smoked or chewed tobacco if anabasine is not detected. However, anabasine is not a sensitive marker of smoked tobacco. It has been reported that the compound may not be detectable in 60% of self-reported smokers (N=51; 3 ng/mL cut-off in urine)9  and its urinary concentrations do not correlate well with self-reported tobacco use.8

As a result, anabasine has low sensitivity for determining eligibility for UNOS (United network for organ sharing) listing. There are some recommendations that this marker should not be used alone. Given that other alkaloids can originate from tobacco plant, it has been proposed that anatabine should be added to analysis due to higher expected concentration.9 However, this alkaloid is not completely specific to tobacco as it has been proposed to also arise from other plant sources 10,11  leading to possible implications for the patient that may be misclassified. In addition, anatabine sensitivity in detecting smoked tobacco use varies depending on the tobacco source and the clinical cut-off used. Clinical tests that include anatabine are not routinely available.

Can we improve this process?

Unfortunately, there is no definitive marker distinguishing smoking from NRT.

The determination of smoking status has advanced from reliance on self-reporting to quantitative and specific measurements of metabolites of nicotine and minor components of tobacco. Additional analyte incorporation into a test panel leads to additional complexities and considerations in interpretation of the results. Therefore, it is important to educate the physicians about various nicotine sources causing a positive nicotine and/or metabolite test result including NRT or e-cigarettes. It is also important to convey the limitations of tobacco alkaloid testing in such scenarios. Both the lab and the physician need to be cautious about implying active smoking in the absence of indirect supporting evidence and/or positive clinical test results.

At the same time, there is a need to improve the utility and availability of other tobacco alkaloid testing in distinguishing cigarette smoking from NRT in specific transplant populations and consider the value of testing alternative specimens. This may lead to a more effective implementation of secondary markers of tobacco use.

References

  1. Qiu, F.; Fan, P.; Nie, G. D.; Liu, H.; Liang, C.-L.; Yu, W.; Dai, Z., Effects of Cigarette Smoking on Transplant Survival: Extending or Shortening It? Frontiers in Immunology 2017, 8, 127.
  2. Zmeskal, M.; Kralikova, E.; Kurcova, I.; Pafko, P.; Lischke, R.; Fila, L.; Valentova Bartakova, L.; Fraser, K., Continued Smoking in Lung Transplant Patients: A Cross Sectional Survey. Zdravstveno varstvo 2016, 55 (1), 29-35.
  3. Vos, R.; De Vusser, K.; Schaevers, V.; Schoonis, A.; Lemaigre, V.; Dobbels, F.; Desmet, K.; Vanaudenaerde, B. M.; Van Raemdonck, D. E.; Dupont, L. J.; Verleden, G. M., Smoking resumption after lung transplantation: a sobering truth. The European respiratory journal 2010, 35 (6), 1411-3.
  4. Hukkanen, J.; Jacob, P., 3rd; Benowitz, N. L., Metabolism and disposition kinetics of nicotine. Pharmacological reviews 2005, 57 (1), 79-115.
  5. Raja, M.; Garg, A.; Yadav, P.; Jha, K.; Handa, S., Diagnostic Methods for Detection of Cotinine Level in Tobacco Users: A Review. Journal of clinical and diagnostic research : JCDR 2016, 10 (3), Ze04-6.
  6. Sandberg, A.; Skold, C. M.; Grunewald, J.; Eklund, A.; Wheelock, A. M., Assessing recent smoking status by measuring exhaled carbon monoxide levels. PloS one 2011, 6 (12), e28864.
  7. Moyer, T. P.; Charlson, J. R.; Enger, R. J.; Dale, L. C.; Ebbert, J. O.; Schroeder, D. R.; Hurt, R. D., Simultaneous analysis of nicotine, nicotine metabolites, and tobacco alkaloids in serum or urine by tandem mass spectrometry, with clinically relevant metabolic profiles. Clinical chemistry 2002, 48 (9), 1460-71.
  8. Jacob, P., 3rd; Hatsukami, D.; Severson, H.; Hall, S.; Yu, L.; Benowitz, N. L., Anabasine and anatabine as biomarkers for tobacco use during nicotine replacement therapy. Cancer epidemiology, biomarkers & prevention : a publication of the American Association for Cancer Research, cosponsored by the American Society of Preventive Oncology 2002, 11 (12), 1668-73.
  9. Feldhammer, M.; Ritchie, J. C., Anabasine Is a Poor Marker for Determining Smoking Status of Transplant Patients. Clinical chemistry 2017, 63 (2), 604-606.
  10. Lanier, R. K.; Gibson, K. D.; Cohen, A. E.; Varga, M., Effects of dietary supplementation with the solanaceae plant alkaloid anatabine on joint pain and stiffness: results from an internet-based survey study. Clinical medicine insights. Arthritis and musculoskeletal disorders 2013, 6, 73-84.
  11. von Weymarn, L. B.; Thomson, N. M.; Donny, E. C.; Hatsukami, D. K.; Murphy, S. E., Quantitation of the minor tobacco alkaloids nornicotine, anatabine, and anabasine in smokers’ urine by high throughput liquid chromatography mass spectrometry. Chemical research in toxicology 2016, 29 (3), 390-397.


VG

-Dr. Valentinas Gruzdys developed interest in clinical chemistry early in his academic training which led him to pursue and obtain a PhD in Clinical and Bioanalytical Chemistry at Cleveland State University. Valentinas is enthusiastic about teaching and helping improve the understanding of limitations and utility of clinical laboratory testing. He is currently enrolled in a clinical chemistry fellowship program at the University of Utah. He enjoys learning more about various aspects of clinical chemistry and cannot wait to make his own contributions to the field after his training.

Hematopathology Case Study: A 56 Year Old Male with an Enlarged Lymph Node

Case History

A 56-year-old male with a past medical history significant for HIV currently on HAART presented to his primary care physician with an isolated enlarged left inguinal lymph node. In the context of his immunocompromised state, the patient was sent for a core needle biopsy of the lymph node to further elucidate the etiology of the isolated lymphadenopathy.

Diagnosis

luetiche20x
H&E, 20x
luetiche50x
H&E, 50x
leutiche100x
H&E, 100x
luetictrep
Treponema immunoperoxidase

The core needle biopsy demonstrated multiple suppurative granulomata with a mixed inflammatory background including abundant plasma cells. The plasma cells are also found to surround small blood vessels. A Treponema immunostain was performed which highlighted the spirochetes. Overall, the diagnosis is that of luetic lymphadenitis.

Discussion

Syphilitic infections can cause isolated lymphadenopathy, especially in the inguinal lymph nodes. The morphologic features of luetic lymphadenitis include interfollicular plasmacytosis, capsular fibrosis, endarteritis, and occasionally sarcoid-like granulomata with rare cases demonstrating suppurative features. The differential diagnosis includes rheumatoid arthritis associated lymphadenopathy but a key histologic difference is that the capsular fibrosis of luetic lymphadenitis will have an infiltrate of lymphocytes and plasma cells while RA associated lymphadenopathy traditionally does not. Immunohistochemistry for Treponema organisms also serves to confirm the diagnosis. It is important to keep in mind the patient’s clinical history when interpreting the biopsy was as well as the differential for interfollicular plasmacytosis with capsular fibrosis.


PhillipBlogPic-small

-Phillip Michaels, MD is a board certified anatomic and clinical pathologist who is a current hematopathology fellow at Beth Israel Deaconess Medical Center, Harvard Medical School, Boston, MA. His research interests include molecular profiling of diffuse large B-cell lymphoma as well as pathology resident education, especially in hematopathology and molecular genetic pathology.

Hematopathology Case Study: A 68 Year Old Man with Dyspnea on Exertion

Case History

A 68 year old male with no significant past medical history who enjoys long distance cycling presented to an outside emergency department with dyspnea on exertion. Laboratory values at the outside facility showed profound anemia (Hb 10 g/dL) and physical exam revealed lymph adenopathy. The patient was discharged but presented again to his primary care physician with profound dyspnea on exertion, especially after climbing one flight of stairs. Of note, his anemia had worsened with a new Hb of 7 g/dL. For evaluation of the anemia, the patient had a Coomb’s test and it was positive, overall consistent with cold agglutinin disease. For evaluation of the lymphadenopathy, a CT abdomen and chest revealed celiac, portocaval, mesenteric and retroperitoneal lymphadenopathy as well as mild splenomegaly. Due to these findings, the patient presented to Beth Israel Deaconess Medical Center for further evaluation and biopsy of a retroperitoneal lymph node.

A core needle biopsy of a retroperitoneal lymph node was obtained per the recommendation of hematology/oncology.

Diagnosis

AITL-1
H&E, 10X
AITL-2
H&E, 20X
AITL-3
H&E, 50X
AITL-4
CD3
AITL-5
CD20
AITL-6
CD10
AITL-7
CD4
AITL-8
CD7
AITL-9
CD21
AITL-10
Ki-67
AITL-11
EBER ISH
AITL-12
PD1
AITL-13
CXCL13

The core needle biopsy material demonstrated a lymphoid population that was polymorphic in appearance with medium to large sized lymphocytes with moderate amounts of pale cytoplasm, irregular nuclei, vesicular chromatin, and some cells with prominent nucleoli. The background cellular population is composed of a mixed inflammatory component including small lymphocytes, scattered neutrophils, eosinophils, and histiocytes.

By immunohistochemistry, the medium to large sized cells with pale cytoplasm are positive for CD3, CD2, CD4, and CD5 with complete loss of CD7. CD20 highlights scattered background B-cells. CD21 is positive in disrupted follicular dendritic meshworks. CD10 and BCL6 are negative in neoplastic cells. PD1 is positive in neoplastic cells with a subset co-expressing CXCL13. By Ki-67 immunostaining, the proliferation index is 50-70%. By in situ hybridization for Epstein-Barr virus encoded RNA, a subset of cells are positive.

Overall, with the morphologic and immunophenotypic features present, the diagnosis is that of angioimmunoblastic T-cell lymphoma.

Discussion

Angioimmunoblastic T-cell lymphoma (AITL) is one of the most common types of peripheral T-cell lymphoma and accounts for 15-20% of T-cell lymphoproliferative disorders and 1-2% of all non-Hodgkin lymphomas. Clinical features include presentation with late stage disease with associated generalized lymphadenopathy, hepatosplenomegaly, systemic symptoms, and polyclonal hypergammaglobulinemia. Of note, this patient did have an SPEP that was within normal limits. Other findings, although less common, include effusions and arthritis. Laboratory findings often include cold agglutinins with hemolytic anemias, a positive rheumatoid factor (RF), and anti-smooth muscle antibodies. A hallmark of AITL is the expansion B-cells positive for EBV is seen, which may be an indicator of underlying immune dysfunction. The clinical course is often aggressive with a median survival of less than three years and often succumb to infectious etiologies because of an immune dysregulation.1

The pathogenesis and relation to other TFH neoplasms of PTCL, NOS is poorly understood. Recent literature indicates dysregulation in key pathways, including the CD28 and TCR-proximal signaling genes, NF-kappaB/NFAT pathway, PI3K pathway, MAPK pathway, and GTPases pathway.2 The complexity of these pathways has long been an issue for TFH lymphoproliferative disorders and has provided insight to potential molecular signatures (see figure 1 adapted from Vallois 2016).

AITL-14
Figure 1 from Vallois 2016

Another recent publication provided additional information regarding molecular insights. Confirmed mutational analyses reveals a high proportion of cases carry a TET2 mutation with less frequent changes in DNMT3A, IDH2, RHOA, and PLCG1. Specifically, RHOA, PLCG1, and TNFRSF21 encode proteins critical for T-cell biology and most likely promote differentiation and transformation into an aggressive clinical course (see figure 2 adapted from Wang 2017).3

AITL-15
Figure 2 adapted from Wang 2017

Overall, AITL is an uncommon TFH cell derived lymphoproliferative disorder characterized by a TFH immunophenotype, expanded and arborizing high endothelial venules, expansion of the follicular dendritic cell meshworks, and EBV positive B-cells in a background of a polymorphic infiltrate. Although it is hypothesized that the underlying mechanism of neoplasia is related to immune dysfunction, new molecular insights have demonstrated that multiple events occur ranging from early molecular changes to later acquired mutations that allow for malignant transformation.

References

  1. Swerdlow, S., et al., WHO Classification of Tumours of Haematopoietic and Lymphoid Tissues, 4th. ed., IARC press: 2008
  2. Vallois, D., et al. “Activating mutations in genes related to TCR signaling in angioimmunoblastic and other follicular helper T-cell-derived lymphomas,” 2016; 128(11): 1490-1502.
  3. Wang, M., et al., “Angioimmunoblastic T cell lymphoma: novel molecular insights by mutation profiling,” 2017; 8(11): 17763-17770.


PhillipBlogPic-small

-Phillip Michaels, MD is a board certified anatomic and clinical pathologist who is a current hematopathology fellow at Beth Israel Deaconess Medical Center, Harvard Medical School, Boston, MA. His research interests include molecular profiling of diffuse large B-cell lymphoma as well as pathology resident education, especially in hematopathology and molecular genetic pathology.

Will Anyone See This Test Result?

We are all aware that there is substantial waste in testing. The mantra of utilization management is “the right test for the right patient at the right time.” This month, I want to focus on the right time. It turns out that many test results are never seen because they arrive after the patient has been discharged. This occurs for both routine and send-out testing. I will examine both.

Turnaround times for send-out testing are generally longer than those for tests performed in house. This means that results for tests ordered toward the end of a hospital stay are likely to be received after the patient has been discharged. Sendout tests are often expensive and, unlike tests performed in house, reducing sendout testing saves the hospital the full charge of the test. The savings can be substantial.

How do you prevent this? A recent article by Fang et al. shows one approach.[1] In this study, conducted at Stanford University, researcher displayed the cost and turnaround time of sendout tests in the computerized provider order entry (CPOE) system and achieved a 26% reduction in orders. I am aware of another hospital that restricts orders of sendout tests when the expected turnaround time is close to the expected remaining length of stay. Consider the graph in Figure 1. The upper panel shows the expected length of stay for a particular patient. The lower panel shows the expected turnaround time for a sendout test. In this case, there is a 62% chance that the test result will arrive after the patient has left the hospital.  Expected discharge dates are routinely kept and it is relatively easy to maintain a database of turnaround times. A hospital could combine these data and set a threshold for orders based on the probability that the result will arrive in time.

Standing orders are another source of waste.  I recently performed an analysis of the test rate as a function of the time until discharge (Figure 2). The test rate was 249 tests per hour for patients who were within 12 hours of discharge and 349 tests per hour for all other patients. It seems odd to me the testing rate in the final 12 hours is 70% of the “normal” testing rate. Further, the distribution of tests in both groups (those about to be discharged vs. all other patients) is very similar (Table 1). The main tests are basic metabolic panels and complete blood counts.  I suspect the majority of the testing within 12 hours of discharge is due to standing orders and the results were not needed for patient care.  The best intervention is less clear in this case because some peri-discharge testing is appropriate and it is difficult to distinguish the appropriate testing from the inappropriate testing. Education is one option. Perhaps the CPOE could raise a flag on orders for patients who are about to be discharged; however, this could be cumbersome and clinicians object to flags and popups that interfere with their workflow. I would be interested in readers’ thoughts on methods to reduce inappropriate peri-discharge testing.

In summary, some results do not reach clinicians in time to affect patient care. This is a source of waste. It is relatively easy to create an intervention to reduce inappropriate sendout testing but more difficult to reduce unnecessary peri-discharge testing.


Reference

  1. Fang DZ, Sran G, Gessner D, Loftus PD, Folkins A, Christopher JY, III, Shieh L: Cost and turn-around time display decreases inpatient ordering of reference laboratory tests: A time series. BMJ Quality and Safety 2014, 23(12):994-1000.


8-2017-fig-1
Figure 1: Comparison of expected length of stay (upper) and turnaround time (lower) for a sendout test.
8-2017-fig-2
Figure 2: Peri-discharge testing
8-2017-tab-1
Table 1: Test patterns stratified by time to discharge. The table shows the percentage of total testing accounted for each group. For example, BMP represents 15% of the total test volume among patients who are within 12 hours of discharge.

Schmidt-small

-Robert Schmidt, MD, PhD, MBA, MS is a clinical pathologist who specializes in the economic evaluation of medical tests. He is currently an Associate Professor at the University of Utah where he is Medical Director of the clinical laboratory at the Huntsman Cancer Institute and Director of the Center for Effective Medical Testing at ARUP Laboratories.


Owning Safety in the Autopsy Suite

The hospital security guard placed the deceased patient into the morgue refrigerator while chatting with his co-worker. They walked away without realizing the door did not close completely. Within the hour the automated temperature recording system sent an alert to the lab on the third floor.

The body had been unclaimed, and it stayed on the bottom shelf in the morgue. No one in the hospital wanted to take ownership of it. After a couple of months, fluids began to fill the shelf where the body was. The environmental services staff refused to clean up the mess since some staff were afraid.

The pathologist wanted to finish the autopsy quickly, so he started before the complete patient chart arrived. When the phone rang in the morgue, the physician on the other end of the phone said he believed the patient may have Creutzfeldt-Jakob Disease (CJD).

Managing safety in the autopsy suite can be difficult, but as these case studies show, it is important. One reason for the struggle is that clear ownership of the area is often not defined. Multiple internal departments and even external agencies may work in the morgue and autopsy suite. Pathologists, medical examiners, research physicians, security personnel, nurses, and organ procurement staff are just some of the various people that may perform tasks in the autopsy suite. This can create some unique and unwanted problems. The laboratory should take the lead in making sure all safety regulations are followed and that other users of the suite comply to avoid any unfortunate mishaps.

The morgue should be treated as a laboratory space, and it should be designed similarly to a BSL-3 laboratory space which includes an anteroom. Warning signs indicating the presence of biological and chemical materials should be placed on entry doors. Whenever work is performed in the area, proper personal protective equipment should be utilized. This PPE may include lab coats, gowns, gloves, respirators, and face protection. Make sure PPE is available in the area at all times. The autopsy space should be adequate, such that procedures may be performed effectively and that items such as knives and saws can be stored and used safely. Ventilation should be adequate (with a recommended minimum 12 air exchanges per hour), and the ambient temperature should be monitored as well.

While other personnel may access the morgue body storage refrigerator, it is often the lab or security departments who monitor the temperature. Since CAP inspectors set specific morgue refrigerator temperature ranges (1.1 to 4.4° Celsius), it can be important to communicate with the people who utilize the unit often. If placing or removing a body takes longer than expected, make sure there is adequate communication so that proper documentation of the temperature outages can be made. If a department other than the lab is responsible for temperature monitoring, make sure it is done correctly so there are no citations during an inspection.

Proper decontamination in the morgue is crucial. Instruments, tables, and counters must be disinfected to remove contamination of bloodborne pathogens. Use a chemical germicide for instrument and surface decontamination such as a 10-percent solution of sodium hypochlorite (or bleach). This intermediate-level disinfection will eliminate most bacteria (including Mycobacterium tuberculosis), and all fungi, and it inactivates viruses such as the hepatitis B virus. Rinsing with water or ethanol after disinfecting will help prevent the pitting of any stainless-steel surfaces.

Dealing with Creutzfeldt-Jakob Disease (CJD) in the autopsy suite requires special safety measures. Procedures should be posted in the area directing staff how to handle tissue and clean up in cases where patients are infected with CJD. The intact brain should be fixed in formaldehyde for one to two weeks before handling or cutting in order to reduce the prion activity. Non-disposable implements used with such patients should be immersed in 1N sodium hypochlorite (NaOH) for one hour before reuse. Surfaces on which autopsies occurred should also be immersed in NaOH for one hour for disinfection purposes.

Chemicals are stored and used in the autopsy suite, and standard safe lab practices should be used. Make sure staff is trained in proper the handling, labeling, and storage of chemicals as well as prepared to handle spills. Spill kits should be available and suitable to the chemicals used in the area. If formaldehyde is used, be sure an appropriate neutralizer is available for spill incidents.

As the most involved and best educated about its dangers, laboratory personnel should take the lead in making sure safety is a priority in the morgue, and educate all who may enter the area. Make sure communication is clear about who will use the suite and when- it’s never good to have someone walk in during an autopsy or organ removal. Use signage when necessary, and be willing to help in any unusual situations, because with a morgue, they definitely will arise. Work together as a team with all who utilize the area, and that ownership of safety will translate into safety for all.


Scungio 1

Dan Scungio, MT(ASCP), SLS, CQA (ASQ) has over 25 years experience as a certified medical technologist. Today he is the Laboratory Safety Officer for Sentara Healthcare, a system of seven hospitals and over 20 laboratories and draw sites in the Tidewater area of Virginia. He is also known as Dan the Lab Safety Man, a lab safety consultant, educator, and trainer.

Jaffe vs. Enzymatic Method for Serum Creatinine Measurement

The Jaffe and enzymatic methods are the two most common methods for measuring serum creatinine. The Jaffe method is less expensive than the enzymatic assay ($0.30 vs $2.00 per test based on 2014 list prices) but is more susceptible to interferences. Although these tests are not expensive, they are high-volume tests and the savings could be substantial. We were using the enzymatic assay at the University of Utah and estimated that we could save about $50,000 per year by switching to the Jaffe assay; however, we were uncertain whether the Jaffe assay was safe to use due to the potential for interferences. For that reason, we decided to conduct a risk assessment to evaluate the suitability of the Jaffe assay.

Risk is defined as the expected cost of an action. The expected cost has two components: 1) the probability that an event will occur and 2) the consequences or cost of an event:

Risk = prob(event) x cost(event)

The event of interest was misclassification of a patient due to an error in serum creatinine measurement. Nephrologists classify kidney disease based on the estimated glomerular filtration rate which is based on the creatinine value. The distribution of eGFR for patients at our hospital is shown in Figure 1. The dashed lines show decision limits that nephrologists use to classify kidney disease. An eGFR is considered normal or healthy.

We spoke with the nephrologists and learned that they were relatively unconcerned about errors in eGFR in healthy patients (eGFR above 60 ml/min) because there was no potential for harm. Similarly, they felt there was relatively little risk of harm to patients with low eGFRs because these patients are routinely monitored and no major decision would be based solely on a single eGFR measurement. An error in creatinine measurement in a low eGFR patient would be detected by repeat measurements or be inconsistent with other measurements. From the nephrologists’ point of view, the only area of concern was in the region around 60 ml/min.  Patients about 60 ml/min are considered healthy whereas those below 60 ml/min are diagnosed with stage 3a chronic kidney disease. In this zone, an error in serum creatinine could result in a false negative (i.e. observed eGFR greater than 60 ml/min when the true eGFR was less than 60 ml/min). In such cases, a patient may go without care and their disease could progress.  The nephrologists believed that the potential for harm was relatively minor, but potential for harm did exist.

We compared the eGFRs provided by the enzymatic and Jaffee methods to estimate how often patients might be misclassified (Figure 2).1 Focusing on the 60 ml/min decision limit, we found that 17 of 500 (3.4%) of measurements were discordant. Some of these discordant results would be due to imprecision. Discordance due to imprecision would have small differences (bottom of Figure 2) and are unavoidable – they would occur using any method. Discordance due to interference would be expected to have larger differences (top of Figure 2) and could be avoided by using the enzymatic method. We used statistical techniques to estimate the proportion of discordances that were due to interference vs imprecision and found that about 60% of the discordance at the 60 ml/min limit was due to interference. In summary, our risk analysis showed that using the Jaffe method would pose about a 2% rate of avoidable misclassification which presented some potential risk to patients. The nephrologists felt the risk was low but, in theory, disease could unnecessarily progress in a patient with a false negative diagnosis.

Our risk analysis was based on analytical error. We compared magnitude of analytical error to the biological variation in eGFR and found that the analytical error was relatively small in comparison to biological variation (data not shown).  Biological variation was likely to be a more significant cause of misclassification than analytical error.

So, what to do? Was the potential savings of the Jaffe method worth the risk? Some experts recommend against using the Jaffe method. 2-4 On the other hand, most US laboratories use the Jaffe assay. A recent College of American Pathologists proficiency challenge found that 70% of the submitted results were based on the creatinine assay.5

We decided to get the best of both worlds by using BOTH methods. We defined a zone of risk surrounding the 60 ml/min eGFR decision limit (Figure 3). Results in this zone would have some risk of misclassification whereas results outside of the zone would be unlikely to be misclassified using the Jaffee method. All creatinine measurements are initially performed using the Jaffe method. If the result is outside the risk zone, the result is reported. If results fell within the risk zone, they were repeated with the enzymatic method and the results of the enzymatic method are reported. This reflex procedure saves money while avoiding risk. The reflex rate is approximately 15%.

There are circumstances in which one would want to order the best possible test. To that end, we created a special orderable test, based on the enzymatic method, that the nephrologists could use to insure the most accurate results when required. For example, the enzymatic test may be indicated when making decisions regarding biopsies for renal transplant patients. The order volume for the special test has been less than 100 orders per year. 

creat1
Figure 1. Distribution of Estimated Glomerular Filtration rates (eGFR). The distribution is for outpatients at University of Utah for calendar year 2014. The dashed lines indicate decision limits used for classification of chronic kidney disease (15, 30, 45 and 60 ml/min). eGFRs greater than 60 ml/min are considered disease free.
creat2
Figure 2. Discordances in estimated glomerular filtration rate (eGFR) at the 60 ml/min decision limit. The length of each arrow, represents the difference between estimates based on the Jaffe (head) and enzymatic (tail) methods. The dashed line represents two standard deviations of expected imprecision of the difference. Differences greater than 2 standard deviations would most likely be due to analytical interference (loss of specificity).
creat3
Figure 3. Reflex test strategy. The figure shows the distribution of eGFR values for outpatients at the University of Utah.  The dashed lines represent clinical decision limits. The yellow zone represents the range of eGFR values where misclassification could pose a risk to patients. Creatinine is first measured by the Jaffe method. The Jaffe result is reported if the estimated eGFR is outside the yellow zone. If the eGFR is within the yellow zone, the measurement is repeated using the enzymatic method and the result based on the enzymatic method is reported.

References

  1. Schmidt RL, Straseski JA, Raphael KL, Adams AH, Lehman CM. A Risk Assessment of the Jaffe vs Enzymatic Method for Creatinine Measurement in an Outpatient Population. PloS one. 2015;10(11):e0143205.
  2. Cobbaert CM, Baadenhuijsen H, Weykamp CW. Prime time for enzymatic creatinine methods in pediatrics. Clinical Chemistry. 2009;55(3):549-558.
  3. Drion I, Cobbaert C, Groenier KH, et al. Clinical evaluation of analytical variations in serum creatinine measurements: Why laboratories should abandon Jaffe techniques. BMC Nephrology. 2012;13(1).
  4. Panteghini M. Enzymatic assays for creatinine: time for action. Scand J Clin Lab Invest Suppl. 2008;241:84-88.
  5. College of American Pathologists. Chemistry/Therapeutic Monitoring, Participant Survey. 2014.


Schmidt-small

-Robert Schmidt, MD, PhD, MBA, MS is currently an Associate Professor at the University of Utah where he is Medical Director of the clinical laboratory at the Huntsman Cancer Institute and Director of the Center for Effective Medical Testing at ARUP Laboratories.

Hematopathology Case Study: What’s in Those Histiocytes?

Case history

A 50 year old female with a past medical history significant for Sjogren’s syndrome and ventricular tachycardia s/p ICD placement presented for a routine chest X-ray in which a 1.8 cm spiculated left upper lobe lung mass was identified. A subsequent PET scan revealed FDG avidity. Other Imaging revealed no lymphadenopathy. The patient is a non-smoker and has no other comorbidities. A core needle biopsy with fiducial placement was performed.

Diagnosis

histio1
H&E 10x
histio2
H&E, 20x
histio3
H&E, 50x
histio4
CD3
histio5
CD20
histio6
CD79a
histio7
IgG
histio8
CD68
histio9
CD138
histio10
Kappa ISH
histio11
Lambda ISH

Sections of lung core biopsy material show numerous histiocytes containing eosinophilic intracytoplasmic globular inclusions. An admixed population of plasma cells are seen which are present in aggregates along with mature appearing lymphocytes. The plasma cells also demonstrate globular inclusions within their cytoplasm.

By immunohistochemistry, CD3 highlights scattered mature T-cells while CD20 highlights B-cells present in focal aggregates. Numerous plasma cells are present and are positive for CD138, CD79a, BCL2, and MUM1. By in situ hybridization, plasma cells are greatly kappa predominant. IgG is positive in the majority of the plasma cells with only rare cells staining for IgA and IgM. CD68 is positive in the numerous histiocytes.

IGH gene rearrangement studies by PCR demonstrated was positive, indicating a clonal population.

Overall, the findings are consistent with a crystal-storing histiocytosis with an associated plasma cell neoplasm or low-grade B-cell lymphoproliferative disorder.

Following the diagnosis, the patient received stereotactic body radiation therapy given the localized findings.

Discussion

In this case, the findings are morphologically consistent with crystal-storing histiocytosis (CSH), which is a rare lesion that is the result of intralysosomal accumulation of immunoglobulin. The immunoglobulin is stored as crystalline structures within histiocytes that occupy the vast majority of a mass forming lesion. Multiple sites can be involved, which include bone marrow, lymph nodes, liver, spleen, gastrointestinal tract, and kidney. Most often, the lesion is confined to a single site but occasional generalized forms with multiple organ involvement have been described. CSH is also often associated with B-cell lymphoproliferative disorders or plasma cell dyscrasias, but rarely are the result of chronic inflammatory conditions.

The assessment of CSH requires excellent staining to identify the quality of the histiocytes. As mentioned, CSH will show intracytoplasmic inclusions that are eosinophilic in nature. Mimickers of CSH include mycobacterial and fungal infections, mycobacterial spindle cell pseudotumor, malakoplakia, HLH, storage disorders such as Gaucher’s, as well as histiocytic lesions such as xanthogranuloma, Langerhans cell histiocytiosis, fibrous histiocytoma, Rosai Dorfman disease and rarely other eosinophilic tumors such as rhabdomyoma, granular cell tumor, and oncocytic neoplasms.1

A thorough review of the literature as well as a clinicopathologic study by Kanagal-Shamanna R et al revealed that the localized type of CSH was the dominant presentation in which over 90% of cases showed isolated masses. Per previous reviews, localized lesions were often found in the head and neck as well as lung.2 A study group in which 13 cases that showed CSH, 12 demonstrated an underlying lymphoma or plasmacytic neoplasm. Interestingly, in 5 of the cases, the histiocytic infiltrate was so prominent and dense that it obscured the underlying neoplasm. In these particular cases, immunohistochemistry and PCR were of great importance.

Although the majority of cases of CSH are the result of an underlying lymphoproliferative disorder or plasma cell neoplasm, rare cases of report inflammatory processes have been described, particularly in the setting of an immune mediated process such as rheumatoid arthritis or Crohn disease.

Overall, although a rare entity, it is important to be aware of CSH and its mimickers as this can be an elusive diagnosis to make, especially when the histiocytic infiltrate is dense.

References

  1. Kanagal-Shamanna R, et al. “Crystal-Storing Histiocytosis: A Clinicopathologic Study of 13 Cases,” Histopathology. 2016 March; 68(4): 482-491.
  2. Dogan S, Barnes L, Cruz-Vetrano WP “Crystal-storing histiocytosis: a report of a case, review of the literature (80 cases) and a proposed classification,” Head Neck Pathol. 2012; 6:11-120.


PhillipBlogPic-small

-Phillip Michaels, MD is a board certified anatomic and clinical pathologist who is a current hematopathology fellow at Beth Israel Deaconess Medical Center, Harvard Medical School, Boston, MA. His research interests include molecular profiling of diffuse large B-cell lymphoma as well as pathology resident education, especially in hematopathology and molecular genetic pathology.

Does Price Transparency Improve Lab Utilization?

Physicians often have poor awareness of costs. For that reason, many believe that providing cost information to physicians would increase awareness that, in turn, could improve laboratory utilization. For example, costs of lab tests could be displayed as a field in the computerized provider order entry system. Interventions of this type are attractive because they are relatively inexpensive to implement and do not disrupt workflow with popups. Further, unlike other interventions, cost display is sustainable. Some interventions require constant training and followup whereas cost display is a one-time intervention. For these reasons, organizations are experimenting to see the effect of cost display on laboratory utilization.

Does cost display reduce lab utilization? Studies have shown wide variation in impact. Most studies have focused on orders for laboratory testing and imaging; however, a few studies have looked a pharmaceuticals.  A recent systematic review concluded that cost display is associated with a modest reduction in laboratory utilization.(1) The review included twelve studies on lab utilization and all of these showed improvement.(2-13) However, a more recent study by Sedrak et al. found that cost-display had no impact on utilization.(14) Similarly, two imaging studies found that cost-display had no effect on orders.(4, 15). There was a wide variation in impact: test utilization reduction ranged from 0% to over 30% in some cases. Overall, it appears that cost display tends to reduce utilization; however, it sometimes has no effect as shown in the Sedrak study. So far, cost display has never been associated with an increase in utilization. We have experimented with cost display at University of Utah and, like the Sedrak study, found no effect.

Why is there such a range of effects? Can we predict which organizations are likely to benefit? The short answer is that nobody knows.  The twelve studies on lab utilization where conducted in a wide range of settings (community, academic and pediatric hospitals), included different numbers of tests, or had other differences that could affect results. The way in which costs are displayed also varies. Some sites use the Medicare Maximum Allowable Reimbursement Rate, some use a series of dollar signs to indicate cost categories, and others use charges. It is not clear whether these differences matter.

There are a number of factors that might affect the impact of cost display. For example, cost display might have less impact at an institution that has an effective utilization management program in place because there is less opportunity for improvement. Or, the number of tests with costs displayed may have an impact. For example, some studies have displayed costs for a relatively few number of tests whereas other studies showed costs for a large number of tests.  Cost display for a few tests may send a different signal to providers than providing costs for all tests. Also, we don’t know how long the intervention works. Is there an initial effect that wears off? If so, how long does it last? These questions will need to be resolved by future studies.

In the meantime, should you provide cost feedback at your institution? It is hard to predict what will happen but most evidence suggests that you will see some improvement in utilization. It is not expensive to implement and some organizations have seen a significant impact. At worst, the evidence suggests that you will see no effect on testing behavior.  On balance, cost-display seems like a low-risk intervention.


References

  1. Silvestri MT, Bongiovanni TR, Glover JG, Gross CP. Impact of price display on provider ordering: A systematic review. Journal of Hospital Medicine 2016;11:65-76.
  1. Fang DZ, Sran G, Gessner D, et al. Cost and turn-around time display decreases inpatient ordering of reference laboratory tests: A time series. BMJ Quality and Safety 2014;23:994-1000.
  1. Nougon G, Muschart X, Gérard V, et al. Does offering pricing information to resident physicians in the emergency department potentially reduce laboratory and radiology costs? European Journal of Emergency Medicine 2015;22:247-52.
  1. Durand DJ, Feldman LS, Lewin JS, Brotman DJ. Provider cost transparency alone has no impact on inpatient imaging utilization. Journal of the American College of Radiology 2013;10:108-13.
  1. Feldman LS, Shihab HM, Thiemann D, et al. Impact of providing fee data on laboratory test ordering: A controlled clinical trial. JAMA Internal Medicine 2013;173:903-8.
  1. Horn DM, Koplan KE, Senese MD, Orav EJ, Sequist TD. The impact of cost displays on primary care physician laboratory test ordering. J Gen Intern Med 2014;29:708-14.
  1. Ellemdin S, Rheeder P, Soma P. Providing clinicians with information on laboratory test costs leads to reduction in hospital expenditure. South African Medical Journal 2011;101:746-8.
  1. Schilling UM. Cutting costs: The impact of price lists on the cost development at the emergency department. European Journal of Emergency Medicine 2010;17:337-9.
  1. Seguin P, Bleichner J, Grolier J, Guillou Y, Mallédant Y. Effects of price information on test ordering in an intensive care unit. Intensive Care Medicine 2002;28:332-5.
  1. Hampers LC, Cha S, Gutglass DJ, Krug SE, Binns HJ. The effect of price information on test-ordering behavior and patient outcomes in a pediatric emergency department. Pediatrics 1999;103:877-82.
  1. Bates DW, Kuperman GJ, Jha A, et al. Does the computerized display of charges affect inpatient ancillary test utilization? Arch Intern Med 1997;157:2501-8.
  1. Tierney WM, Miller ME, McDonald CJ. The effect on test ordering of informing physicians of the charges for outpatient diagnostic tests. N Engl J Med 1990;322:1499-504.
  1. Everett GD, Deblois CS, Chang PF. Effect of Cost Education, Cost Audits, and Faculty Chart Review on the Use of Laboratory Services. Arch Intern Med 1983;143:942-4.
  1. Sedrak MS, Myers JS, Small DS, et al. Effect of a Price Transparency Intervention in the Electronic Health Record on Clinician Ordering of Inpatient Laboratory Tests: The PRICE Randomized Clinical Trial. JAMA Internal Medicine 2017.
  1. Chien AT, Ganeshan S, Schuster MA, et al. The effect of price information on the ordering of images and procedures. Pediatrics 2017;139.


Schmidt-small

-Robert Schmidt, MD, PhD, MBA, MS is a clinical pathologist who specializes in the economic evaluation of medical tests. He is currently an Associate Professor at the University of Utah where he is Medical Director of the clinical laboratory at the Huntsman Cancer Institute and Director of the Center for Effective Medical Testing at ARUP Laboratories.