Will Anyone See This Test Result?

We are all aware that there is substantial waste in testing. The mantra of utilization management is “the right test for the right patient at the right time.” This month, I want to focus on the right time. It turns out that many test results are never seen because they arrive after the patient has been discharged. This occurs for both routine and send-out testing. I will examine both.

Turnaround times for send-out testing are generally longer than those for tests performed in house. This means that results for tests ordered toward the end of a hospital stay are likely to be received after the patient has been discharged. Sendout tests are often expensive and, unlike tests performed in house, reducing sendout testing saves the hospital the full charge of the test. The savings can be substantial.

How do you prevent this? A recent article by Fang et al. shows one approach.[1] In this study, conducted at Stanford University, researcher displayed the cost and turnaround time of sendout tests in the computerized provider order entry (CPOE) system and achieved a 26% reduction in orders. I am aware of another hospital that restricts orders of sendout tests when the expected turnaround time is close to the expected remaining length of stay. Consider the graph in Figure 1. The upper panel shows the expected length of stay for a particular patient. The lower panel shows the expected turnaround time for a sendout test. In this case, there is a 62% chance that the test result will arrive after the patient has left the hospital.  Expected discharge dates are routinely kept and it is relatively easy to maintain a database of turnaround times. A hospital could combine these data and set a threshold for orders based on the probability that the result will arrive in time.

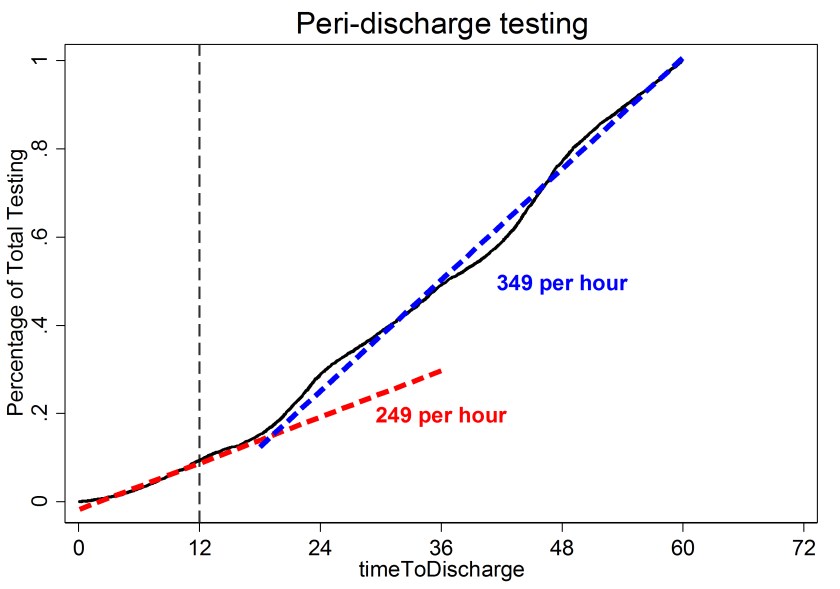
Standing orders are another source of waste.  I recently performed an analysis of the test rate as a function of the time until discharge (Figure 2). The test rate was 249 tests per hour for patients who were within 12 hours of discharge and 349 tests per hour for all other patients. It seems odd to me the testing rate in the final 12 hours is 70% of the “normal” testing rate. Further, the distribution of tests in both groups (those about to be discharged vs. all other patients) is very similar (Table 1). The main tests are basic metabolic panels and complete blood counts.  I suspect the majority of the testing within 12 hours of discharge is due to standing orders and the results were not needed for patient care.  The best intervention is less clear in this case because some peri-discharge testing is appropriate and it is difficult to distinguish the appropriate testing from the inappropriate testing. Education is one option. Perhaps the CPOE could raise a flag on orders for patients who are about to be discharged; however, this could be cumbersome and clinicians object to flags and popups that interfere with their workflow. I would be interested in readers’ thoughts on methods to reduce inappropriate peri-discharge testing.

In summary, some results do not reach clinicians in time to affect patient care. This is a source of waste. It is relatively easy to create an intervention to reduce inappropriate sendout testing but more difficult to reduce unnecessary peri-discharge testing.


Reference

  1. Fang DZ, Sran G, Gessner D, Loftus PD, Folkins A, Christopher JY, III, Shieh L: Cost and turn-around time display decreases inpatient ordering of reference laboratory tests: A time series. BMJ Quality and Safety 2014, 23(12):994-1000.


8-2017-fig-1
Figure 1: Comparison of expected length of stay (upper) and turnaround time (lower) for a sendout test.
8-2017-fig-2
Figure 2: Peri-discharge testing
8-2017-tab-1
Table 1: Test patterns stratified by time to discharge. The table shows the percentage of total testing accounted for each group. For example, BMP represents 15% of the total test volume among patients who are within 12 hours of discharge.

Schmidt-small

-Robert Schmidt, MD, PhD, MBA, MS is a clinical pathologist who specializes in the economic evaluation of medical tests. He is currently an Associate Professor at the University of Utah where he is Medical Director of the clinical laboratory at the Huntsman Cancer Institute and Director of the Center for Effective Medical Testing at ARUP Laboratories.


Does Price Transparency Improve Lab Utilization?

Physicians often have poor awareness of costs. For that reason, many believe that providing cost information to physicians would increase awareness that, in turn, could improve laboratory utilization. For example, costs of lab tests could be displayed as a field in the computerized provider order entry system. Interventions of this type are attractive because they are relatively inexpensive to implement and do not disrupt workflow with popups. Further, unlike other interventions, cost display is sustainable. Some interventions require constant training and followup whereas cost display is a one-time intervention. For these reasons, organizations are experimenting to see the effect of cost display on laboratory utilization.

Does cost display reduce lab utilization? Studies have shown wide variation in impact. Most studies have focused on orders for laboratory testing and imaging; however, a few studies have looked a pharmaceuticals.  A recent systematic review concluded that cost display is associated with a modest reduction in laboratory utilization.(1) The review included twelve studies on lab utilization and all of these showed improvement.(2-13) However, a more recent study by Sedrak et al. found that cost-display had no impact on utilization.(14) Similarly, two imaging studies found that cost-display had no effect on orders.(4, 15). There was a wide variation in impact: test utilization reduction ranged from 0% to over 30% in some cases. Overall, it appears that cost display tends to reduce utilization; however, it sometimes has no effect as shown in the Sedrak study. So far, cost display has never been associated with an increase in utilization. We have experimented with cost display at University of Utah and, like the Sedrak study, found no effect.

Why is there such a range of effects? Can we predict which organizations are likely to benefit? The short answer is that nobody knows.  The twelve studies on lab utilization where conducted in a wide range of settings (community, academic and pediatric hospitals), included different numbers of tests, or had other differences that could affect results. The way in which costs are displayed also varies. Some sites use the Medicare Maximum Allowable Reimbursement Rate, some use a series of dollar signs to indicate cost categories, and others use charges. It is not clear whether these differences matter.

There are a number of factors that might affect the impact of cost display. For example, cost display might have less impact at an institution that has an effective utilization management program in place because there is less opportunity for improvement. Or, the number of tests with costs displayed may have an impact. For example, some studies have displayed costs for a relatively few number of tests whereas other studies showed costs for a large number of tests.  Cost display for a few tests may send a different signal to providers than providing costs for all tests. Also, we don’t know how long the intervention works. Is there an initial effect that wears off? If so, how long does it last? These questions will need to be resolved by future studies.

In the meantime, should you provide cost feedback at your institution? It is hard to predict what will happen but most evidence suggests that you will see some improvement in utilization. It is not expensive to implement and some organizations have seen a significant impact. At worst, the evidence suggests that you will see no effect on testing behavior.  On balance, cost-display seems like a low-risk intervention.


References

  1. Silvestri MT, Bongiovanni TR, Glover JG, Gross CP. Impact of price display on provider ordering: A systematic review. Journal of Hospital Medicine 2016;11:65-76.
  1. Fang DZ, Sran G, Gessner D, et al. Cost and turn-around time display decreases inpatient ordering of reference laboratory tests: A time series. BMJ Quality and Safety 2014;23:994-1000.
  1. Nougon G, Muschart X, Gérard V, et al. Does offering pricing information to resident physicians in the emergency department potentially reduce laboratory and radiology costs? European Journal of Emergency Medicine 2015;22:247-52.
  1. Durand DJ, Feldman LS, Lewin JS, Brotman DJ. Provider cost transparency alone has no impact on inpatient imaging utilization. Journal of the American College of Radiology 2013;10:108-13.
  1. Feldman LS, Shihab HM, Thiemann D, et al. Impact of providing fee data on laboratory test ordering: A controlled clinical trial. JAMA Internal Medicine 2013;173:903-8.
  1. Horn DM, Koplan KE, Senese MD, Orav EJ, Sequist TD. The impact of cost displays on primary care physician laboratory test ordering. J Gen Intern Med 2014;29:708-14.
  1. Ellemdin S, Rheeder P, Soma P. Providing clinicians with information on laboratory test costs leads to reduction in hospital expenditure. South African Medical Journal 2011;101:746-8.
  1. Schilling UM. Cutting costs: The impact of price lists on the cost development at the emergency department. European Journal of Emergency Medicine 2010;17:337-9.
  1. Seguin P, Bleichner J, Grolier J, Guillou Y, Mallédant Y. Effects of price information on test ordering in an intensive care unit. Intensive Care Medicine 2002;28:332-5.
  1. Hampers LC, Cha S, Gutglass DJ, Krug SE, Binns HJ. The effect of price information on test-ordering behavior and patient outcomes in a pediatric emergency department. Pediatrics 1999;103:877-82.
  1. Bates DW, Kuperman GJ, Jha A, et al. Does the computerized display of charges affect inpatient ancillary test utilization? Arch Intern Med 1997;157:2501-8.
  1. Tierney WM, Miller ME, McDonald CJ. The effect on test ordering of informing physicians of the charges for outpatient diagnostic tests. N Engl J Med 1990;322:1499-504.
  1. Everett GD, Deblois CS, Chang PF. Effect of Cost Education, Cost Audits, and Faculty Chart Review on the Use of Laboratory Services. Arch Intern Med 1983;143:942-4.
  1. Sedrak MS, Myers JS, Small DS, et al. Effect of a Price Transparency Intervention in the Electronic Health Record on Clinician Ordering of Inpatient Laboratory Tests: The PRICE Randomized Clinical Trial. JAMA Internal Medicine 2017.
  1. Chien AT, Ganeshan S, Schuster MA, et al. The effect of price information on the ordering of images and procedures. Pediatrics 2017;139.


Schmidt-small

-Robert Schmidt, MD, PhD, MBA, MS is a clinical pathologist who specializes in the economic evaluation of medical tests. He is currently an Associate Professor at the University of Utah where he is Medical Director of the clinical laboratory at the Huntsman Cancer Institute and Director of the Center for Effective Medical Testing at ARUP Laboratories.

Utilization Management – Where Have We Been and Where Are We Now?

Healthcare organizations are under increasing pressure to increase value. It is well known that a significant portion of laboratory testing is unnecessary. As a result, many organizations have started laboratory utilization management programs (LUMP) to reduce the waste associated with laboratory orders. Each month, I’ll address a series of topics related utilization management.

Conceptually, LUM is not difficult. It is much like any other improvement process such as Deming’s PDSA cycle (Plan Do Study Act) or the DMAIC (define, measure, analyze, improve, and control) cycle used by Six-Sigma. In the context of LUM, one must identify opportunities for improvement, design and implement an intervention, and study the results. Most organizations are familiar with these approaches and utilization management is nothing more than directing these improvement methodologies to laboratory testing.

The success of a LUMP depends on the proper organization of the program. Top management support is very important. At my hospital, the LUMP was driven by an initiative called Value Driven Outcomes which was started by the Dean of the Medical School, Vivian Lee.(1) This program affected all parts of the organization – including the lab. We formed a LUM committee that was chaired by the Chair of Internal Medicine and included high-level representatives from Information Technology, Pathology, Finance, and education. The high-level support made it possible to overcome resistance and move quickly. I speak to many clinicians and managers across the country who are involved in LUM. Almost invariably, those who have top-level support are more satisfied with their progress. In contrast, those who approach LUM from the bottom up are less satisfied. They make progress, but the path is more difficult.

Identifying opportunities for improvement is the most challenging part of UM Opportunities are usually identified by comparing performance against a guideline. Unfortunately, the number of tests (~2500) far outnumbers the availability of guidelines (~200).

Benchmarking is alternate approach that can be applied to almost any test. In benchmarking, one compares testing patterns across a number of organizations and looks for outliers(2). The presumption, which is not necessarily true, is that unusual order patterns are associated with unusual order patterns and that tests with unusual order patterns are most likely high-yield targets.

There are several good sources of guidelines. The Choosing Wisely campaign provides a good list of tests that are obsolete. A forthcoming CLSI document on utilization has a chapter that provides a long list of targets. Repeat testing is also a common target and several recent guidelines have been published on testing intervals. (3-5)

Although there remains much to be discovered with respect to guidelines, interventions are fairly static. I haven’t seen much new since the 1990’s. A recent review categorized interventions as education, audit and feedback, system-based, or penalty/reward.(6) All of these seem to work, but there is a lot of variation across studies – even within one intervention. A forthcoming CDC study will add to this literature.

Overall, the bottleneck in LUMPs are finding guidelines and doing the analysis to determine whether an opportunity exists. National organizations such as CLSI do a great service by compiling this information.

That is the overview. Next time, I’ll pick a more specific topic.


  1. Kawamoto K, Martin CJ, Williams K, et al. Value Driven Outcomes (VDO): a pragmatic, modular, and extensible software framework for understanding and improving health care costs and outcomes. Journal of the American Medical Informatics Association 2014:amiajnl-2013-002511.
  1. Signorelli H, Straseski JA, Genzen JR, et al. Benchmarking to Identify Practice Variation in Test Ordering: A Potential Tool for Utilization Management. Laboratory medicine 2015;46:356-64.
  1. Janssens PMW, Wasser G. Managing laboratory test ordering through test frequency filtering. Clinical Chemistry and Laboratory Medicine 2013;51:1207-15.
  1. Orth M, Aufenanger J, Hoffmann G, et al. Recommendations for the frequency of ordering laboratory testing. LaboratoriumsMedizin 2015;38.
  1. Lang T. National Minimum Re‐testing Interval Project: A final report detailing consensus recommendations for minimum re‐testing intervals for use in Clinical Biochemistry. https://www.rcpath.org/asset/BBCD0EB4-E250-4A09-80EC5E7139AB4FB8/. 3013. Accessed: May 30 2017.
  1. Kobewka DM, Ronksley PE, McKay JA, Forster AJ, Van Walraven C. Influence of educational, audit and feedback, system based, and incentive and penalty interventions to reduce laboratory test utilization: A systematic review. Clinical Chemistry and Laboratory Medicine 2015;53:157-83.


Schmidt-small

-Robert Schmidt, MD, PhD, MBA, MS is a clinical pathologist who specializes in the economic evaluation of medical tests. He is currently an Associate Professor at the University of Utah where he is Medical Director of the clinical laboratory at the Huntsman Cancer Institute and Director of the Center for Effective Medical Testing at ARUP Laboratories.


Test Utilization: A Deeper Look

The test utilization seminar I attended at the AACC annual meeting (I talked about it here) presented fascinating information that I’m going to try and sum up for you.

Test utilization isn’t just about ordering the right test, making sure the order entry system is efficient, or even about the accuracy of the test. Sure, all those factors are important, but patients aren’t treated by laboratory data. They’re treated by doctors, and those doctors are human. Humans are irrational and make mistakes for all sorts of reasons like fear, cognitive limitations, and social complications. Medical decisions are incredibly complex and driven my mounds of data. This complexity contributes to medical errors.

I found this notion counter intuitive—one would think that more data would mean better decisions. However, a study conducted by the CIA on horse race prediction found that when analysts were given more data, the accuracy of their predictions didn’t improve. However, the analysts had more confidence in their predictions. What does this mean? Just because your doctor runs fifty tests doesn’t mean he’ll diagnose you accurately. It probably means, though, the doctor will be confident they are right.

Another tidbit from the seminar: diagnostic error is usually the convergence of several different factors that are organizational, cognitive, and technical in nature. Any laboratory professional who has dealt with major errors has seen this in action—an event investigation will usually reveal that anything that could go wrong did, and that’s why the event occurred. The authors of this particular study did note that technical/equipment problems contributed to only a small fraction of diagnostic errors. This speaks to the integrity, critical thinking, dedication to quality that laboratory professionals possess.

If you want to read more, here are a few of the studies mentioned during the talk:

Diagnostic Error in Internal Medicine http://archinte.jamanetwork.com/article.aspx?articleid=486642

CIA: Do You Really Need More Information? https://www.cia.gov/library/center-for-the-study-of-intelligence/csi-publications/books-and-monographs/psychology-of-intelligence-analysis/art8.html


Swails

Kelly Swails, MT(ASCP), is a laboratory professional, recovering microbiologist, and web editor for Lab Medicine.

Right Test, Right Time, Right Patient: The Age of Lab Stewardship

Last week, I attended the American Association of Clinical Chemistry (AACC) conference in Chicago. I attended molecular diagnostics talks but also talks about quality improvement, the use of “big data,” and lab stewardship. I have an interest in QI as my AACC poster presentation last year was on lab interventions to reduce lab error frequency and I am also a resident on my hospital’s performance improvement committee.

So, what exactly is “big data?” It’s a word that we are hearing more often in the media these days. It’s also a term that is increasingly being used in our healthcare systems. In 2001, analyst Doug Laney defined “big data” as the “3 V’s: volume, velocity, and variety” so that’s as good a point as any to start deconstructing its meaning.

Volume refers to the enormous amounts of data that we can now generate and record due to the blazing advancement of technology. It also implies that traditional processing matters will not suffice and that innovative methods are necessary both to store and analyze this data. Velocity refers to the ability to stream data at speeds that most likely exceed our ability to analyze it completely in real-time without developing more technically advanced processors. And finally, variety refers to the multiple formats, both structured (eg – databases) and unstructured (eg – video), in which we can obtain this data.

I’m always amazed at the ability of the human mind to envision and create something new out of the void of presumed nothingness. Technology has always outstripped our ability to harness its complete potential. And the healthcare sector has usually been slower to adopt technology than other fields such as the business sector. I remember when EMR’s were first suggested and there was a lot of resistance (in med school, not that long ago, I still used paper patient charts). But now, healthcare players feel both pressure from external policy reforms and internal culture to capture and analyze “big data” in order to make patient care more cost-effective, safe, and evidence-based. And an increasing focus and scrutiny (and even compensation) on lab stewardship is a component of this movement.

I often find myself in the role of a “lab steward” during my CP calls. The majority of my calls involve discussing with, and sometimes, educating, referring physicians about the appropriateness of tests or blood products that they ordered…and not uncommonly, being perceived as the test/blood product “police” when I need to deny an order. But lab stewardship goes both ways. And these days, the amount of learning we need to keep up with to know how to be a good lab steward is prodigious, daunting, and sometimes, seemingly impossible.

So do you believe in this age of lab stewardship that it’s the job of the pathologist to collect and analyze “big [lab] data” and to employ the results to help ordering physicians to choose the right test at the right time for the right patient? Or is it a collaborative effort with ordering physicians? With patients? How do you foresee that the future practice of medicine needs to change from standards of practice currently?


Chung

-Betty Chung, DO, MPH, MA is a third year resident physician at Rutgers – Robert Wood Johnson University Hospital in New Brunswick, NJ.

Test Utilization Made Easy

Just kidding–this sort of thing isn’t easy. Right?

Not so fast. A few days ago I attended a session on test utilization management at the AACC meeting in Chicago. While the issue is quite complex–it’s not just a matter of right test/right patient/right time (which is tough enough already)–the speakers gave the audience a few relatively easy ways to improve test utilization.

  • Find and fix ordering errors
  • Identify tests with limited clinical use and eliminate them from your menu
  • Suggest a better test for the same disease/condition
  • Identify and correct deviations from established guidelines
  • Investigate odd patterns. (For example, if General Hospital generates 5% of your business but accounts for 70% of test X.)
  • Monitor year-to-year practice variations

As I said, this issue is quite complex, but implementing even a few of these changes could improve your lab’s bottom line.


Swails

Kelly Swails, MT(ASCP), is a laboratory professional, recovering microbiologist, and web editor for Lab Medicine.