Hematology Case Study: Spurious CBC results on a Chronic Lymphocytic Leukemia patient

Working in Hematology, I have learned that things aren’t always black and white. With about 80-85% of our CBC’s autovalidating, it’s those other “problem child” specimens that can give us a challenge. When we get one of these tricky specimens, it’s time to put on our detective hats and investigate what is going on.

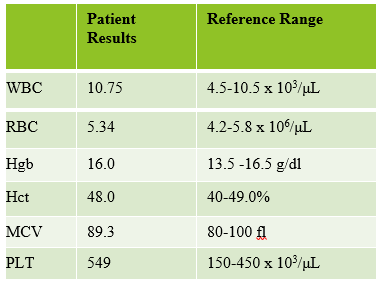
This patient was a 65-year-old female with Chronic Lymphocytic Leukemia (CLL). WBC and RBCs are counted on our analyzer by impedance, which sorts cells by size. When we ran this sample, we noticed a few things right away. See results below in Figure 1.

Figure 1. Original CBC results with Instrument Flags

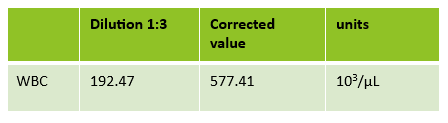
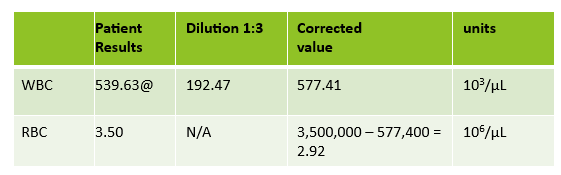
The first thing I notice on this specimen is the @ next to the WBC. This indicates that the count is over linearity and was confirmed by dilution. The corrected WBC was 577 x 103/mL. See Figure 2.

Figure 2. 1:3 dilution results for WBC. 192.47 x 3 = 577.41 x 10³/μL

Extreme leukocytosis may interfere with the RBC, HGB, HCT and MCV determinations. The degree of RBC interference depends on the number and size of WBCs present. WBC and RBC are counted using impedance technology. In impedance counting, the RBC count is done first by passing the sample though the aperture in the RBC/platelet channel. This count is actually the sum of both RBC and WBC counts. Then, the RBCS are lysed and the WBCs are counted in the WBC channel. Normally, the WBC count has very little, if any, effect on the reported RBC count. Normal RBC counts are 4-6 million/μL. Normal WBC counts are a fraction of this, at about 5-10,000/μL. If the the RBC count is 3.50 x 10⁶/μL and the analyzer includes 10,000 WBCs in the count, this only changes the RBC to 3.51 x 10⁶/μL. (3,500,000 + 10,000 = 3,510,000). Because WBC counts are so much lower than RBC counts, even if a WBC count is 100,000, the effect on the RBC count is clinically insignificant. (3,500,000 + 100,000= 3,600,000 = 3.60 x 10⁶/μL) However, in this patient, the WBC count was 577,000/μL. After reviewing the smear and confirming the WBC count with a WBC estimate, we corrected the RBC count, by subtracting the WBC from the RBC. As you can see in figure 3 below, the extreme leukocytosis did affect the RBC count.

Figure 3. Corrected RBC count. Subtract the WBC count from the RBC count. Corrected RBC (cRBC) = RBC (x 106/μL) – WBC (x 103/μL)

So, how does this affect the hematocrit? The next thing noticed right away is that the Hgb and Hct don’t follow the “rules of 3”. Now, we know that these rules really only hold true for normocytic, normochromic RBCS, but extreme leukocytosis can interfere with Hct determination. A Hgb of 9.2 g/dL and Hct 39.4% doesn’t look ‘right’. We have just corrected the RBC count, and now we need to ask ourselves how this can affect the Hct. The hematocrit is the packed cell volume, or the % of red blood cells per total volume of the sample. Since we now know that the RBC count is 2.92 x 10⁶/μL, not 3.50 x 10⁶/μL, we can correct the hematocrit. If you have a hematocrit centrifuge in your laboratory, a spun hematocrit can be used to determine the corrected hematocrit. After correcting the Hct, you must also correct the MCV using the following formula.

Corrected MCV (cMCV) = HCT(%) x 10/cRBC

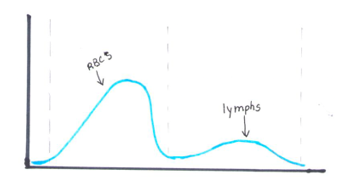
Another option for resolving interferences and correcting the Hct for extreme leukocytosis is using the clues that the RBC histogram gives us. We know the RBC count needed correcting, and we subtracted the WBC to get the corrected RBC. This sample had multiple flags. One of them was “Dimorphic population”. This indicates two populations of RBCs in the sample. Since we know a considerable number of WBCs were counted in the RBC chamber, this would account for the dimorphic population. A dimorphic population on histogram looks like what I call a ‘double humped camel’. In this case, the patient’s RBCs are the first, smaller population and the lymphocytes of this CLL patient are the 2nd larger population. See Figure 4.

Figure 4. Example of a dimorphic RBC histogram.

Another option for recalculating the MCV is using the information in the service tab of your analyzer. Note that the results from the service tab are not FDA approved, and therefore not directly reportable, so must be confirmed first. If using values from the service tab, the spun hematocrit and calculations can be used as a check. The service tab displays the MCV of these 2 populations. These are listed as the MCV of the small population, S-MCV, and the MCV of the large cell population, L-MCV. Using the small MCV (sMCV) value and the corrected RBC (cRBC), we can back calculate the Hct using the following formula.

Corrected Hct (cHct) (%) = (sMCV x cRBC)/10

For this sample:

S-MCV = 105.1

L-MCV= 215.4

(cHct) (%) = 105.1 x 2.92/10 = 30.7 %

Hgb is another parameter that may be affected by extreme leukocytosis. Turbidity may be present in the diluted and lysed sample when reading the Hgb. This sample did not give us a Hgb turbidity flag, but because of the high WBC, the Hgb was confirmed using a diluted sample. The sample was diluted 1:3 with the analyzer diluent. Results were multiplied by the dilution factor. Lastly, when performing Hgb corrections (and in this case, also the RBC corrections) you must also recalculate the MCH and MCHC using the corrected values. Figure 5 shows these corrected values.

MCH (pg)= (cHgb/cRBC) x 10

MCHC (g/dL) =(cHgb/cHct) x 100

Figure 5. Corrected CBC results

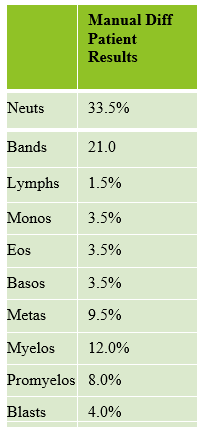
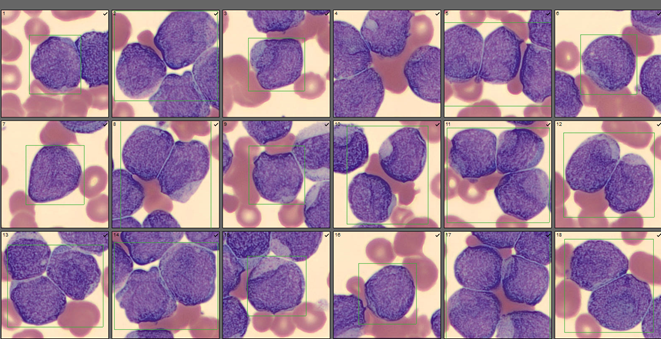
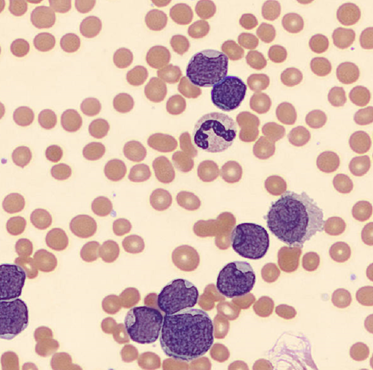
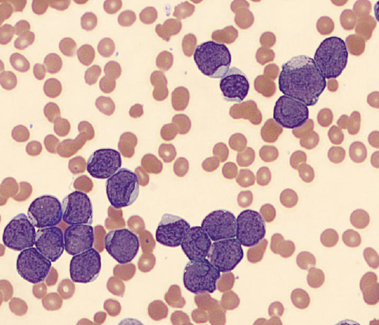
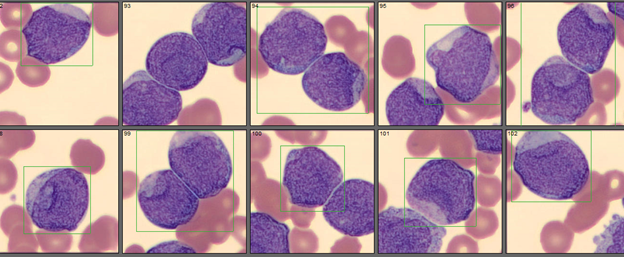
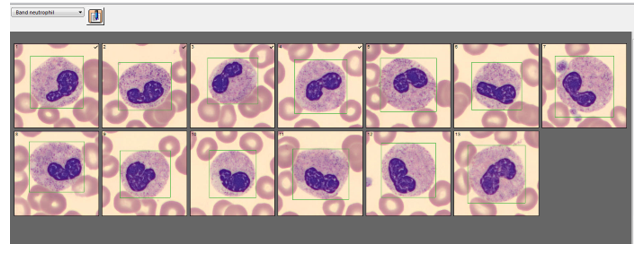
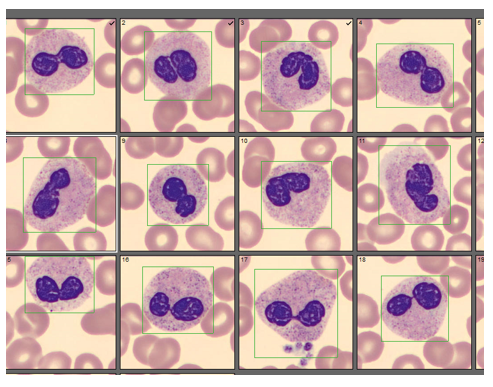
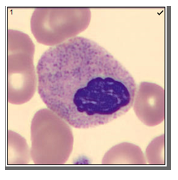
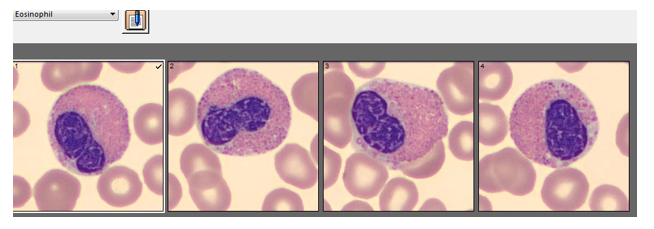
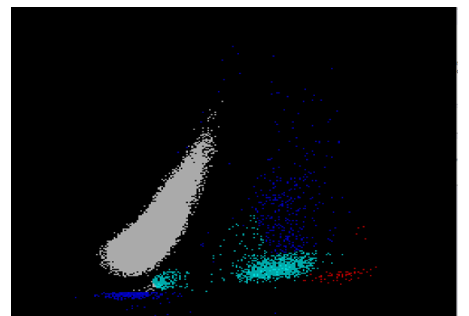
We can breathe a sigh of relief that we finally have accurate and reliable results for the CBC. But what about the differential? This big ugly grey mess seen in Figure 6 on the differential scattergram indicates a very abnormal scattergram. This is telling us that there is no separation between the types of cells. There were multiple flags for WBC abnormal scattergram, leukocytosis, lymphocytosis, and a flag for dimorphic RBC populations. These flags are all telling us not to accept the instrument results. In these cases, we want to review the smear, do a WBC estimate, and perform a manual differential, examining the differential carefully to look for any abnormalities. The differential had many lymphocytes and smudge cells. An albumin smear was made to resolve the smudge cells and a manual differential was performed.

Figure 6. WDF Scattergram

I’ll admit that this type of specimen is not something we encounter every day (thankfully). But I thought it a very interesting example of a spurious results on many levels. These challenges are some of my favorite things about working in Hematology. Using autovalidation is a great tool in the laboratory to help workflow. With about 85% of specimens autovalidating, this allows us to spend time on these tricky specimens. And this tricky specimen was an epic one! We had CBCs on this patient several days in a row. Unfortunately, some of her results were simply repeated and reported. Some WBC results over linearity were reported without dilution. Other parameters were not corrected. This gives inconsistent and confusing results to the physicians and is not beneficial to the patient. Because of the inconsistencies, we issued a couple corrected reports which can be very time consuming. Sometimes we may not have the answers and can’t resolve a problem. If a specimen cannot be resolved, it is always better to report what you can and use ‘not reported’ or ‘not measured’ for any results that are not available. It’s better to report the good results that you have than to report junk that physicians can’t rely on. I often say that simply repeating a sample and reporting results if they match is not sufficient. We need to investigate spurious results so that we may report the best quality results possible for every patient.

References

  1. Gulati G, Uppal G, Gong J. Unreliable Automated Complete Blood Count Results: Causes, Recognition, and Resolution. Ann Lab Med. 2022 Sep 1;42(5):515-530. doi: 10.3343/alm.2022.42.5.515. PMID: 35470271; PMCID: PMC9057813.
  2. Sysmex USA. XN-Series Flagging Interpretation Guide. Document Number: 1166-LSS, Rev. 6, March 2021
  3. Zandcki, M. et al. Spurious counts and spurious results on haematology analysers: a review. Part II: white blood cells, red blood cells, haemoglobin, red cell indicies and reticulocytes. International Journal of Laboratory Hematology. 09January 2007.
Socha-small

-Becky Socha, MS, MLS(ASCP)CMBBCM graduated from Merrimack College in N. Andover, Massachusetts with a BS in Medical Technology and completed her MS in Clinical Laboratory Sciences at the University of Massachusetts, Lowell. She has worked as a Medical Technologist for over 40 years and has taught as an adjunct faculty member at Merrimack College, UMass Lowell and Stevenson University for over 20 years.  She has worked in all areas of the clinical laboratory, but has a special interest in Hematology and Blood Banking. She currently works at Mercy Medical Center in Baltimore, Md. When she’s not busy being a mad scientist, she can be found outside riding her bicycle.

Case Studies in Hematology: Hemoglobin S Beta Thalassemia Compound Heterozygosity in a 61 Year Old Female

A 61 year old Black woman with a diagnosis of sickle cell beta thalassemia presented to the ER with fatigue, dyspnea, and back and leg pain with some swelling in the hands and feet. Splenomegaly was noted on exam. The patient has a history of moderate to severe symptomatic anemia and is being followed by a hematologist. Her baseline Hgb is 9-10 g/dL. Her treatment plan includes Hydroxyurea, 500 mg daily, and transfusions, as needed. Her last sickle cell crisis was 2 years ago. CBC was ordered. Hgb on admission was 6.1 g/dL. Her RBC morphology showed polychromasia, target cells, sickle cells, anisocytosis, and numerous nucleated RBC forms.

The patient was admitted to the hospital. Type and crossmatch for 2 units of packed red blood cells was ordered. CT imaging was performed and revealed severe osteopenia and vertebrae deformities consistent with her history of sickle cell disease. Chest CT showed hypoinflated lungs and areas of consolidation in the lower lobes consistent with acute chest syndrome due to sickle cell beta thalassemia. She was transfused with 2 units of pRBCs and treated for sickle cell crisis. The patient remained stable and was discharged 3 days later.

Table 1. CBC results on ER admission
Figure 1. Peripheral blood smear on admission. Patient with sickle cell/beta thalassemia shows sickle cells, target cells, nucleated red cells, anisocytosis, poikilocytosis, polychromasia. (Mercy Medical Center, Baltimore, Md)

Sickle cell anemia (HbSS) and thalassemia are the world’s most common single gene disorders. Both are inherited in an autosomal recessive manner, and result in hemolytic anemias. But what happens when you inherit one gene for sickle cell and one gene for beta-Thalassemia (β-thalassemia)?

Sickle cell disease is caused by mutations in the HBB gene that provide instructions for making beta-globin. Sickle cell anemia is a hemoglobinopathy, a qualitative defect in the structure of globin chains, resulting in the production of abnormal hemoglobin. Normal adult Hemoglobin A has 2 α chains and 2 β chains (α2β2). Hb S results from the substitution of valine for glutamic acid at position 6 of the β globin chain. The resultant Hb S has reduced solubility at low oxygen tensions. Patients with sickle cell anemia have a moderate to severe chronic hemolytic anemia with recurrent painful sickle cell crisis.

Sickle cell disease is inherited in an autosomal recessive pattern from parents who have at least one mutated gene. Anyone with a sickle cell gene can pass this gene on to their children. Sickle cell anemia (HbSS) is the homozygous expression of a sickle gene from both parents and is the world’s most common inherited hematological disease. A heterozygote inherits a sickle gene from only one parent. This person is a carrier of sickle cell (HbSs), often referred to as sickle cell trait. HbSs persons do not generally exhibit symptoms or may exhibit only a mild anemia. However, under stressful conditions, such as at high altitudes, they may experience vaso-occlusive sickle crisis.

While hemoglobinopathies are a qualitative defect due to structural changes in the normal amino acid sequence of globin, thalassemias result from an imbalance in the synthesis of the globin chains that make up the hemoglobin molecule. Thalassemias involve the rate of globin chain synthesis leading to a quantitative defect. Thalassemia is divided into α-thalassemias and β-thalassemia. α-thalassemias involve genes for the α chains on chromosome 16. In α-thalassemia, the deletions involve the α1 and/or the α2 globin genes and result in decreased production of α chains. β-thalassemias mainly affect β chain production. They are disorders of reduced globin chain production from the globin chain cluster on chromosome 11.

(Since this case involves a known diagnosis with a compound heterozygous state involving a β-thalassemia gene mutation, the discussion of α-thalassemia has been limited here. Watch for a case involving α-thalassemia in a future blog!)

Beta thalassemia occurs when the beta globin chains are either produced inadequately or not at all. There are many mutations in and around the β globin gene that result in decreased β chain production. Mutations that result in the complete absence of β chain production are designated as β0. In the most severe form of β-thalassemia the patient is homozygous β00 and does not produce any β chains. Without β chains there is no Hb A (α2β2). β+ is used as the designation for any mutations of the β globin gene that cause a partial deficiency of β chains (5-30% decrease) and therefore result in a decrease in production of Hb A. The βsilent designation is used for carrier state gene mutations that result in only a mildly decreased β chain production. The degree of decrease in the β chain production is related to the degree of anemia and the severity of clinical disease.

Thalassemia, like sickle cell anemia, is a hereditary anemia inherited in the autosomal recessive manner. β-thalassemia is divided into categories based on clinical severity of disease. In β-thalassemia major a child inherits a copy of a β-thalassemia gene mutation from both parents. There are various mutations that cause genes with these mutations and different variants may be inherited from each parent. A person with thalassemia major may be homozygous β+/ β+, homozygous β0/ β0, or the compound heterozygous state β+/ β0. Hb A is only produced in patients with the β+ mutation. β-thalassemia major patients have the most severe hemolytic anemia and symptoms. β-thalassemia intermedia is characterized as homozygous βsilent or heterozygous βsilent with β+ or β0 and mild to moderate disease. β-thalassemia minor, also called β-thalassemia trait or carrier state, presents with mild but asymptomatic hemolytic anemia. These patients are heterozygous with normal β globin and have slightly decreased Hb A.

In people with sickle cell disease, at least one of the beta globin is replaced with hemoglobin S. In homozygous sickle cell anemia, both beta globin subunits in hemoglobin are replaced with hemoglobin S. In compound sickle cell diseases, one beta globin is replaced with hemoglobin S and the other beta globin is replaced with a different abnormal variant. Examples of this are Hb SC disease, and Hb SD syndrome. Compound heterozygosity is the inheritance of two different mutated genes that share the same locus. If mutations that produce hemoglobin S and beta thalassemia occur together, individuals have hemoglobin S-beta thalassemia disease. (sickle cell beta-thalassemia, Hb S β thal or sickle-β-thal). Sickle cell beta thalassemia patients have hemoglobin S (α2β26Glu→Val) and either β0 or β+.

When a qualitative hemoglobinopathy is inherited with a quantitative disorder of hemoglobin synthesis, the severity of the compound disorder is dependent on the β gene mutation. Patients with β0 produce no Hb A and have moderate to severe symptoms comparable to that of Hb SS patients. β+ patients will produce some β chains and therefore have some Hb A and milder or no symptoms.

Figure 2. Peripheral Blood smear on day 3. Sickle cell forms, polychromasia, target cells. nucleated RBCs. (Mercy Medical Center, Baltimore, Md)

Newborn screening can diagnose β0-thalassemia at birth by detecting a complete absence of hemoglobin A. However, it is not possible to make a definitive diagnosis of β+-thalassemia in the newborn because newborns have Hb F, and the reduced amount of hemoglobin A overlaps the range for normal babies. In adults with Hb S – β thal the amount of Hb S is variable. There is some Hb A in β+ patients but no Hb A detected in β0. Hb A2 and Hb F are increased. In addition to hemoglobin electrophoresis, molecular testing may also aid in the diagnosis by identifying genetic mutations. Beta globin gene sequencing can identify beta thalassemia alleles that are caused by point mutations in the beta globin gene. As well, structural variants of the beta globin gene such as Hb S can be identified with this technique. This can lead to a better understanding and clinical management of the disease.

Case Study, continued: This patient inherited a Hb S gene from one parent and a β-thal gene from the other, resulting in sickle cell beta thalassemia. This compound heterozygosity affects red blood cells both by the production of structurally abnormal hemoglobin, and by the decreased synthesis of beta globin chains. Clinical manifestations depend on the amount of beta globin chain production. Symptoms may include anemia, vascular occlusion, acute episodes of pain, acute chest syndrome, pulmonary hypertension, sepsis, ischemic brain injury, splenic sequestration crisis and splenomegaly.

Hemoglobin electrophoresis was sent out to a reference lab and results are shown in Table 2. Based on the Hemoglobin electrophoresis, is this patient Hb S- β0-thal or Hb S- β+-thal?

Table 2. Hemoglobin pattern and concentrations of a S/betathalassemia patient

Hemoglobin electrophoresis results for Hb S beta thalassemia patients are expected to show 60-90% Hb S and 10-30% Hg F. This patient’s Hgb S at 74% is within this range. This result reflexed a sickle solubility test, which was positive. As well, the elevated Hb F and Hb A2 are consistent with this diagnosis. It was noted in the discussion above that Hb S- β+-thal mutations cause a decrease of 5-30% in beta chains and therefore a decrease in Hb A. This patient’s Hb S is greater than the Hb A and her Hb A concentration is 14.8%, which is consistent with this diagnosis. Hb S- β0 mutations produce no Hb A. In this case there is some Hb A on electrophoresis but not as much as would be expected in a β+-thal mutation. Also, of note it that this patient was recently transfused with 2 units of pRBCs. Interpretations of hemoglobin electrophoresis assume that the patient has not been transfused in the last 3 months. The Hb A in this patient can be explained by these recent transfusions. Therefore, it can be concluded that the hemoglobin pattern and concentrations are consistent with transfusion of a Hb S beta0 thalassemia patient. The β0 mutation is also consistent with this patient’s moderately severe symptomatic anemia.

References

  • Keohane, Elaine, et al. Rodak’s Hematology, Clinical Principles and Application, 5th ed, Elsevier, 2016
  • McKenzie, Shirlyn. Clinical laboratory Hematology. Pearson Prentice Hall, 2004.
  • McGann PT, Nero AC, Ware RE. Clinical Features of β-Thalassemia and Sickle Cell Disease. Adv Exp Med Biol. 2017;1013:1-26. doi: 10.1007/978-1-4939-7299-9_1. PMID: 29127675.
  • Origa R. Beta-Thalassemia. 2000 Sep 28 [Updated 2021 Feb 4]. In: Adam MP, Mirzaa GM, Pagon RA, et al.,editors. GeneReviews® [Internet]. Seattle (WA): University of Washington, Seattle; 1993-2023. Available from: https://www.ncbi.nlm.nih.gov/books/NBK1426/
  • Turgeon, Mary Louis. Clinical Hematology Theory and Procedures, 6th ed, Jones and Bartlett Learning, 2017.
Socha-small

-Becky Socha, MS, MLS(ASCP)CMBBCM graduated from Merrimack College in N. Andover, Massachusetts with a BS in Medical Technology and completed her MS in Clinical Laboratory Sciences at the University of Massachusetts, Lowell. She has worked as a Medical Technologist for over 40 years and has taught as an adjunct faculty member at Merrimack College, UMass Lowell and Stevenson University for over 20 years.  She has worked in all areas of the clinical laboratory, but has a special interest in Hematology and Blood Banking. She currently works at Mercy Medical Center in Baltimore, Md. When she’s not busy being a mad scientist, she can be found outside riding her bicycle.

Bandemia: What is it and Why is it Important?

Recently our lab was asked by physicians to start reporting band counts of ≧10% as critical values. While we have always reported bands when a manual differential is performed, we have also heard for years about other labs that have stopped reporting bands. Mayo Clinic stopped reporting bands in the 1990’s- other nationally and internationally known hospitals and community hospitals alike have followed suit. CAP proficiency surveys for cell ID do not separate segmented neutrophils and band neutrophils for cell IDs. Our hematology analyzer reports Immature granulocytes (IG) and we have learned about the benefits of IG over the band count. Thus, when our pathologists asked us to add a critical value for bandemia, we wondered if we were moving ‘backwards’.

Bandemia is defined as elevated band neutrophils in the peripheral blood. Neutrophils are produced to help fight infection. With infection, there is an increase in WBCs being released by the bone marrow into the peripheral blood. Bands are considered mature neutrophils and can fight infection, and in an effort to keep up with demand, some of these infection fighting cells which are released are bands. However, we are reminded that this is a nonspecific clinical finding. Bands can be elevated in many situations including inflammation, autoimmune disease, metabolic abnormalities, pregnancy, and treatment with granulocyte colony stimulating factors. Band counts of ≧10% have been used clinically as an indicator of serious bacterial illness. A finding of bandemia can help providers decide what steps need to be taken in evaluation of a patient, and in conjunction with clinical findings, can help in making a differential diagnosis.

The trouble with bands is that they are notoriously difficult to measure accurately and precisely. Bands are somewhat controversial and there are conflicting opinions on the utility of bands. Should bands be reported or included with neutrophils? A left shift reflects bone marrow response to bacterial infection, and this has been quantified as band count or immature granulocyte count. Is the IG a better parameter than the band count?

If your Hematology analyzer reports the absolute neutrophil count (ANC) with an automated differential, this includes all mature neutrophils. The theory that supports this is that neutrophilic bands and segmented neutrophils are both mature cells, and both fight infection. A true left shift would therefore be the presence of immature granulocytes (metamyelocytes, myelocytes and promyelocytes). Yet, we also now have analyzers that offer a 6-part differential that includes the immature granulocyte (IG) count. And we know that an automated differential is based on counting thousands of cells, and a manual differential is based on counting 100 cells. So, which is better? We can theorize that the IG is a better indicator of left shift because the automated diff count looks at more cells than a 100-cell manual diff.

Let’s say that we have a patient with a WBC of 20 x 103/μL. Left shift is defined as an absolute IG count >0.1 x 10³/μL. Automated diffs can count >30,000 cells depending on the WBC count. If the auto diff counts 32,000 cells and finds 1% IG, this means that the analyzer identified 320 IG. Absolute counts are calculated as % x the WBC, in this case 0.01 x 20,000=.2 x 103/μL. This meets the definition of a left shift. If we do a manual diff and count 100 cells and see 1 meta, the absolute IG would be .2 x 103/μL, again meeting the criteria for a left shift. However, if we did not see any metas or other IG on the manual diff, the absolute IG would be 0. Thus, performing a manual diff, the difference in seeing 1 cell or 0 would make the difference of reporting a suspected infection versus no suspicion of infection.

Table 1: Left shift? comparison of absolute IG when 1 or no IGs are seen on manual diff

With the advent of the IG count on automated differentials, labs have moved away from reporting bands. I have attended conferences and heard presentations about “banning” bands. A few years ago, I wrote a blog called “Beyond Bands: The Immature Granulocyte Count”, describing the benefits of using the IG count over bands in manual diffs. The above example would support “Ban the bands” arguments. Using the IG count from analyzers can take advantage of analyzing many more cells and give us statistically more precise values.

Results from auto diff can get to patients’ chart faster than a manual diff result, leading to faster treatment. To report bands, a manual differential must be done. We must wait for a slide to be made, dry, and a diff to be analyzed either under the microscope or on CellaVision. Bands are subjective, relying on technologist interpretation.

So, why are we suddenly being asked to make bandemia a critical value?

Physicians asked for this change and have cited cases where patients were seen in the emergency department (ED) and subsequently released, later to return, or experiencing negative outcomes. These patients had bands reported on differentials. Other area hospitals are reporting bands and have critical values for bandemia. Because patients often are seen at more than one area hospital, and doctors may have privileges at more than one of these, for consistency, this makes sense. But is also makes sense clinically.

Recent data has drawn renewed attention to bands as a reliable predictor of severity of patient condition. A number of research papers have been published that indicate that bands may indeed be important for patient care. A 2012 study investigated bandemia in patients with normal white blood cell counts. This cohort study found that patients with normal WBC counts with moderate (11%-18%) or high (>20%) band counts had increased odds of having positive blood cultures and in-hospital mortality. (Drees, 2012)

In 2019 a study showed that there was an “increasing risk for death with increasing bandemia, irrespective of leukocyte count. (Davis, 2019) A 2021 study done at Rhode Island Hospital showed a strong correlation between increasing percentages of bands on an initial emergency room CBC and the likelihood of significant positive blood cultures and in-hospital mortality. This was noted even at band levels below 10%. (Hseuh, 2021) S. Davis, MD, from the Department of Emergency Medicine, George Washington University School of Medicine and Health Sciences, in Washington, DC wrote that “While emergency physicians may find reassurance in a normal leukocyte count, the balance of evidence strongly suggests a more prudent approach would be to wait for the bands.” (S. Davis, 2021) In other words, wait for that manual differential. He stated that emergency room physicians get results from automated CBCs before the manual diff and do not see or are aware of any internal laboratory flags on these specimens. Physicians should be aware of reporting processes to avoid early discharge of otherwise well-appearing patients before band counts are reported. Last year, trends in bandemia and clinical trajectory among patients was reviewed in a retrospective chart review at George Washington University Hospital. They noted that “Bandemia clearance and trending, in conjunction with other existing clinical tools, may be of use as a marker of improvement in sepsis. Conversely, worsening bandemia may be predictive of a deteriorating clinical status and possibly a higher mortality.” They also noted that following trends of band levels in patients with sepsis or septic shock may help to predict a clinical course and overall prognosis. (Prasanna, 2022) Additionally, a band count greater than 10% is one of the American College of Chest Physicians/Society of Critical Care Medicine’s systemic inflammatory response syndrome (SIRS) criteria used to diagnose sepsis. (Chakraborty, 2022) These are just a few of the many articles that support a clinical utility of reporting the band count.

When we first learned that we would be reporting bandemia as a critical value, we realized that we would need to get everyone on the same page. We do most of our diffs on CellaVision, so, in theory, that should be easy, but, and a big but, is that bands are notoriously subjective. Different technologists may have been taught or have used their own definitions of bands. Variation can occur depending on slide quality, tech training, definition of bands used, and number of cells counted. So, how do we make this work? We need to be sure that all our technologists are reporting bands using the same criteria, so we are not reporting differing or confusing information to physicians. The concern lies in a physician making a significant clinical decision based on apparent changes in band counts that are not real but only reflect predictable statistical factors and unpredictable technologist variability.

In our laboratory, we approached the implementation of this new critical value as an educational opportunity. Differentials that had been performed on our CellaVision were reviewed, and it was apparent that bands were not being categorized consistently among techs. (See Figure1) We started with reviewing the definition of bands with all technologists and writing updated detailed procedures that includes these definitions. We use CAP’s definition of bands, which is the definition used in most textbooks and references for over 60 years. (See Table 1) Many examples of both bands and segmented neutrophils were added to our reference library on CellaVision. These included textbook perfect bands and some that may be more subjective. These reference cells can be used by techs to compare cells when making decisions as to in which category they belong. It was also stressed to techs that they need to look at cells carefully, and in a view that is large enough to see both detail and differentiation.

Figure1. Cells reported as segmented neutrophils on Differential. How many bands do you see?
Table 2. CAP Definition of bands vs segmented neutrophils
Figure 2. Are these bands or segmented neutrophils?

Patient samples that had bands reported were located on CellaVision and multiple slides were made from these samples to be used as competency slides. In developing the differential evaluation tool, Rumke’s data showed that for a differential with a reported 12% bands, a second differential would have to have greater than 23% bands or fewer than 3% bands before the difference could be considered statistically significant. But this can be significant to our patients and patient care. In this example, diffs with <10% bands would not indicate bandemia, and diffs over 10% would initiate a critical bandemia call. And this could happen on the same slide depending on who did the diff, or on sequential samples on the same patient over a short period of time. These competency slides were assigned to techs to collect statistics on the mean and SD of the bands reported on each slide. Retraining and coaching will be provided as necessary. Follow up competency slides will be assigned, and statistics will be recalculated. The goal is to decrease variability in our band counts and to show that we have done so. This ongoing quality project has involved writing procedures, offering continuing education, assigning and reviewing competency slides, coaching technologists and reviewing slides with them and calculating statistics. Our goal is consistency and reporting meaningful results to our physicians. 

As we saw in the studies cited above, % bands and trends are both important when evaluating clinical correlations. The chart below shows examples of how this might affect patient care. If a patient on presenting at the ED had a 19% band count, this would be called as a critical, and the patient would be further evaluated, and depending on clinical symptoms and medical history would likely have blood cultures drawn and be admitted to the hospital. If a second tech did the diff and reported 5% bands, the patient may be sent home without further evaluation. On subsequent CBCs, we could be giving confusing results to the physician if we are not consistent in our reporting. With multiple techs doing differentials on different shifts, it could look like this patient is getting better,

getting worse, or it could look like the patient is responding to therapy, and then the next day they had a setback. While we understand that bands will probably always be somewhat subjective, we need to narrow this down. By adhering to one definition, our goal is to report consistent and accurate results.

Table 3. Various results on differentials on the same patient over the course of 3 days, showing technologist dependent results.

ED physicians are looking for an early marker that can be used to identify septic patients as early as possible. Bandemia may be used as this marker. We therefore need to be as objective as possible when reporting bands. “Ultimately the band count is only one factor amongst several others which will be used in assessing the patient’s clinical state and in determining any subsequent medical management. Yet, identifying bands is important, and emphasizes the key role that our laboratory professionals play in identifying causes for concern” Dr Edgar Alonsozana, Mercy Medical Center, Baltimore, Md.

I welcome your comments about how your laboratories report bands and if bandemia is a critical value in your facilities!

References

P.Joanne Combleet, Clinical utility of the band count, Clinics in Laboratory Medicine, 2002;22:101-136

Al-Gwaiz, Layla A. and H H Babay. “The Diagnostic Value of Absolute Neutrophil Count, Band Count and Morphologic Changes of Neutrophils in Predicting Bacterial Infections.” Medical Principles and Practice 16 (2007)

S. Davis, R. Shesser, K. Authelet, A. Pourmand. “Bandemia” without leukocytosis: A potential Emergency Department diagnostic pitfall. The American Journal of Emergency Medicine,Volume 37, Issue 10, 2019

Harada T, Harada Y, Morinaga K, Hirosawa T, Shimizu T. Bandemia as an Early Predictive Marker of Bacteremia: A Retrospective Cohort Study. Int J Environ Res Public Health. 2022 Feb 17;19(4):2275.

Christine DeFranco DO and Terrance McGovern DO MPH
St. Joseph’s Regional Medical Center, Paterson, NJ. Isolated Bandemia: What Should We Do with It? Critical Care, Oct. 2016,

Harmening, Denise. Clinical hematology and Fundamentals of Hemostasis, 4th ed. 1997

Prasanna N, DelPrete B, Ho G, et al. The utility of bandemia in prognostication and prediction of mortality in sepsis. Journal of the Intensive Care Society. 2022;0(0).

https://www.mlo-online.com/home/article/13007276/answering-your-questions

Takayuki Honda, Takeshi Uehara, Go Matsumoto, Shinpei Arai, Mitsutoshi Sugano, Neutrophil left shift and white blood    cell count as markers of bacterial infection,Clinica Chimica Acta, Volume 457, 2016

Drees M, Kanapathippillai N, Zubrow MT. Bandemia with normal white blood cell counts associated with infection. Am J Med. 2012 Nov;125(11):1124.e9-1124.e15.

Leon Hsueh, Janine Molino, Leonard Mermel,

Elevated bands as a predictor of bloodstream infection and in-hospital mortality,The American Journal of Emergency Medicine,2021

https://www.ncbi.nlm.nih.gov/books/NBK547669/

Socha-small

-Becky Socha, MS, MLS(ASCP)CMBBCM graduated from Merrimack College in N. Andover, Massachusetts with a BS in Medical Technology and completed her MS in Clinical Laboratory Sciences at the University of Massachusetts, Lowell. She has worked as a Medical Technologist for over 40 years and has taught as an adjunct faculty member at Merrimack College, UMass Lowell and Stevenson University for over 20 years.  She has worked in all areas of the clinical laboratory, but has a special interest in Hematology and Blood Banking. She currently works at Mercy Medical Center in Baltimore, Md. When she’s not busy being a mad scientist, she can be found outside riding her bicycle.

Lymphocyte Subset Panels (AKA T4T8 Assays)

While writing my last blog, I asked “What is your least favorite test to do in Hematology?” (I’m not ignoring our favorite tests! I will get to those in another blog.) And then, I started thinking about why we may not like certain testing. Is it because they are time consuming, or repetitive? Is it because they hurt our eyes, or necks, or fingers? Or is it because it’s a test that we perform but we may not be sure what the test is for, or we don’t understand the theory behind it? I started thinking about my coworkers and other tests that could be on those lists and I immediately decided that a good candidate in our lab is the T4T8 panel. Probably the primary reason is that the instrument we do these on has given us many problems over the last year. The instrument has spent most of the year with an “instrument out of service” sign on it. Service has been here many times, but the instrument just appears to have exceeded its life expectancy. In normal times, when the instrument was in its prime, setting up and running a T4T8 panel does require a number of steps, and some time. In the last year we have had to add lots of coaxing, even more time, and some luck to get the test to run. This can be frustrating in any lab situation, but is particularly frustrating when we are short staffed, trying to train new staff, and very busy. So, I don’t think it’s the test itself that techs dislike, it’s the time it takes, not being comfortable with setting up the test, juggling our other work while struggling with another instrument, and the fact that even after we get results, a percentage of the samples have results that don’t meet our criteria and still need to be sent out to the reference lab. 

Another reason why this test may be a little intimidating is its unfamiliarity. It’s not a test that is done in every lab. I have worked as a Medical Laboratory Scientist for many years. I’ve worked in 6 labs since the mid 1980’s and the introduction of CD4 testing for human immunodeficiency virus (HIV) patients, yet my current place of work is the first place that we have done these in house. Before this job, if you asked me or any of my coworkers what a T4T8 panel was, we probably would have answered “a send out test”. A few weeks ago, we had a call from a doctor asking questions about his patient’s T4T8 assay results. The tech answering the phone got a blank look on their face and quickly handed the phone to me. This told me that techs, and even doctors, may not really understand what this test is testing and what the results mean. This further confirmed to me that the lack of knowledge about these tests may be another reason why these don’t win any popularity contests in our lab.

So, what exactly is a T4T8 panel?

Some other names for the test are a Lymphocyte subset panel, an Immuno T-cell (CD3/4/8) assay, T-Cell subsets Percent and Absolute panel or T-Lymphocyte Helper/Suppressor Panel. As a quick review, we know that lymphocytes are either B-lymphocytes or T-lymphocytes. Immunotyping lymphocytes can provide information for disease diagnosis and monitoring. All T-lymphocytes express CD3 antigens on their surfaces, which can be used to differentiate B-cell disorders from T-cell disorders. T-lymphocyte subsets include T-helper/inducer cells which express both CD3 and CD4, and T-cytotoxic/suppressor cells, which express CD3 and CD8. In a T4T8 panel we are concerned with identifying T-lymphocytes, and the percentage of each subset both individually, and compared to one another.

The test we perform uses monoclonal antibodies, anti CD3, anti CD4 and anti CD8, which recognize specific human lymphocyte subsets. Our reagents come as antibody containing tubes and are run on the Cell-Dyn Sapphire. After performing a CBC on the sample, the instrument is programmed to add an aliquot of the sample to the CD3 +CD4 reagent tube and a second aliquot to the CD3 + CD8 reagent tube. Immunophenotyping is performed by flow cytometry on these 2 aliquot tubes. The CD3 antibody in both tubes separates out all T-lymphocytes, and the addition of the CD4 in the first tube identifies the cells which are also CD4 positive, the T4 or helper cells. The CD3 + CD8 tubes identifies the percentage of T cells that are T8 or suppressor cells. The assay uses the CBC results and the immunophenotyping runs to calculate the helper/suppressor ratio, also known as T4/T8 ratio or CD4/CD8 ratio.

Why is this test performed?

After the discovery of lymphocyte subset abnormalities in human immunodeficiency virus (HIV) patients in the 1980s, lymphocyte immunophenotyping has become widely used in this patient population for the evaluation of their prognosis, immune deficiency status, response to therapy, and diagnosis of AIDS. The test is most often done to assess HIV infection status but may also be useful in the diagnosis and monitoring of other diseases or after organ transplantation. Some examples of conditions in which this assay may be useful include other viral and bacterial infections, severe combined immunodeficiency, Hodgkin disease, certain leukemias, multiple sclerosis, and myasthenia gravis. A newer application of CD4/CD8 ratios are as potential biomarkers of cancer progression. The most interesting new use of T-cell subset testing that I have read about has been with the recent COVID-19 pandemic. Several studies have shown that CD4 and CD8 T- cell counts reflected disease severity and can predict clinical outcomes of COVID-19 infection. These studies have concluded that COVID-19 patients presenting with relatively low CD4 and CD8 T-cell counts are more severely infected and may have a worse prognosis. The Abbott test we use was designed to be used to monitor immune status in (HIV)-infected individuals. It is not intended for screening for leukemic cells or for phenotyping samples in leukemia patients.

What do the results mean?

The absolute CD4 count and CD4/CD8 Ratio can be used as a snapshot of immune system health. Normal absolute CD4 counts are 600 to 1200 /mm3. In immune suppression, values drop below 500/mm3 and in advanced infection, values of less than 200/mm3 are consistent with a definition of acquired immunodeficiency syndrome (AIDS). In advanced disease, some patients may have a normal CD4 count but experience a weakening immune system. Or the immune system can become exhausted and unable to produce sufficient T-cells. The CD4/CD8 ratio is useful for judging the strength of the immune system. A normal CD4/CD8 ratio is between 1.0 and about 3.0-4.0.

 T-helper cells start the defensive immune response by signaling other cells that infectious pathogens are present. At initial infection with HIV, T-suppressor cells increase in an effort to destroy infected cells. We see an increase in CD8 cells as the CD4 cells are destroyed. These events result in a low CD4/CD8 ratio. When HIV antiretroviral therapy (ART) is initiated, the ratio will usually, gradually return to normal. However, if ART is not started or if the immune system is severely affected, the body may not be able to make adequate new CD4 cells and the ratio may never return to normal.

With the availability of very effective therapies available for the treatment of HIV, the CD4/CD8 ratio has become more important in patients with long term HIV infection. Recent studies have suggested that people with a low CD4/CD8 ratio who have been on treatment for years are at an increased risk from non-HIV illnesses such as cardiovascular and renal disease.

CD4 counts are important in HIV management and used to guide treatment including the decision to initiate prophylactic treatment against opportunistic infections. It is recommended that CD4 counts be performed every 3-6 months after initiation of ART. After the first 2 years on ART, CD4 monitoring can be decreased in frequency to every 12 months for people whose CD4 count is between 300 and 500 and may be considered optional for those with CD4 counts over 500. Table 1 and 2 shown below are examples of patient reports for the T4T8 assay.

Table 1. Patient with AIDS, CD4 count 200, T4/T8 ratio 0.16*
Table 2. Patient with absolute CD4 within normal range, but CD4/CD8 below 1.0*

*There are times when the absolute or % CD3T may be less than the sum of the CD4T and CD8T. This is due to averaging of CD3T counts from the 2 monoclonal tubes

In our lab, these tests are performed daily, as they are received, from 7am to 7PM, 7 days a week. There are no commercial quality control materials available for the test, so we must choose negative and positive QC from our patient population. For the QC we choose patients with CBC and WBC differential values within normal ranges, with no flags. There are additional age and diagnosis/treatment related restrictions on samples that can be used as controls. Our in-house patients often have abnormal results, and our patient population also includes our large outpatient hematology/oncology center. Thus, at times, finding appropriate controls can be challenging. I can add this to the list of ‘problems’ with this test and why techs don’t like them. Call me weird, but I actually like doing these! I like the challenge of finding QC, I like that they are ‘different’ from the hundreds of CBCs we perform each day, and I look at them as a little change in routine and a chance to do something unique. Though I wish the instrument would run perfectly every day, I even (sort of) don’t mind troubleshooting when it’s not working. I like solving problems! I enjoy teaching others how to run these, and I enjoy answering questions about the test.

Many thanks to my great coworker Jacky Olive for her assistance always and inspiration for this blog. I know these are not your favorite test!

*There are times when the absolute or % CD3T may be less than the sum of the CD4T and CD8T. This is due to averaging of CD3T counts from the 2 monoclonal tubes

Becky Socha MS, MLS(ASCP)CMBB

References

  • Abbott Laboratories, Cell Dyn Immuno T-Cell (Cd3/4/8 )ReagentsPackage Insert. Abbott Park, Il.
  • Li Raymund; Duffee Doug; Gbadamosi-Akindele Maryam F.CD4 Count. NIH National Library of Medicine. May 8, 2022
  • Domínguez-Domínguez L, Rava M, Bisbal O, et al. Cohort of the Spanish HIV/AIDS Research Network (CoRIS). Low CD4/CD8 ratio is associated with increased morbidity and mortality in late and non-late presenters: results from a multicentre cohort study, 2004-2018. BMC Infect Dis. 2022 Apr 15;22(1):379.
  • Liu Z, Long W, Tu M et al. Lymphocyte subset (CD4+, CD8+) counts reflect the severity of infection and predict the clinical outcomes in patients with COVID-19. Journal of Infection. Vol 81, Issue 2. P318-356, AUGUST 01, 2020
  • Kagan JM, Sanchez AM, Landay A, Denny TN. A Brief Chronicle of CD4 as a Biomarker for HIV/AIDS: A Tribute to the Memory of John L. Fahey. For Immunopathol Dis Therap. 2015;6(1-2):55-64
  • McBride JA, Striker R (2017) Imbalance in the game of T cells: What can the CD4/CD8 T-cell ratio tell us about HIV and health? PLoS Pathog 13(11)
  • Sinha A, Mystakelis H, Rivera AS, Manion M, et al. Association of Low CD4/CD8 Ratio With Adverse Cardiac Mechanics in Lymphopenic HIV-Infected Adults. J Acquir Immune Defic Syndr. 2020 Dec 1;85(4)
  • Wang YY, Zhou N, Liu HS, Gong XL, Zhu R, Li XY, Sun Z, Zong XH, Li NN, Meng CT, Bai CM, Li TS. Circulating activated lymphocyte subsets as potential blood biomarkers of cancer progression. Cancer Med. 2020 Jul;9(14)
Socha-small

-Becky Socha, MS, MLS(ASCP)CMBBCM graduated from Merrimack College in N. Andover, Massachusetts with a BS in Medical Technology and completed her MS in Clinical Laboratory Sciences at the University of Massachusetts, Lowell. She has worked as a Medical Technologist for over 40 years and has taught as an adjunct faculty member at Merrimack College, UMass Lowell and Stevenson University for over 20 years.  She has worked in all areas of the clinical laboratory, but has a special interest in Hematology and Blood Banking. She currently works at Mercy Medical Center in Baltimore, Md. When she’s not busy being a mad scientist, she can be found outside riding her bicycle.

Hematology Case Study: Presenting a Double Feature Starring Chronic Myelogenous Leukemia

One of the reasons I love working in Hematology is because when we have unexpected results they are often accompanied by visuals… and a picture is worth a thousand words! Unusual or critical results in Chemistry can be interesting, sometimes there are dilutions to perform, results to compare or puzzles to solve, I have always loved working up a good antibody or complicated multiple antibodies in Blood Bank or calculating how many units I may need to screen to find compatible ones, gram stains of unusual organisms in Microbiology can be exciting, but nothing beats some of the cells we see in Hematology! It’s always fascinating when we find unusual cells and follow up with smear reviews with our pathologists. And, being able to save these visuals in CellaVision or saving the slides for teaching, is a plus. These cases are a gift that keeps on giving! Lately I’ve had my share of “exciting” specimens, usually on a Saturday or Sunday afternoon! It never fails to get the adrenaline going when you are the first one to see a CBC with a WBC of 400,000, a differential that is over 90% blasts, rare lymphoma cells, malarial parasites, or a body fluid smear full of malignant cells. The following 2 cases are a very remarkable looking smear and a not so remarkable one, from 2 different patients with the same diagnosis.

The first patient is a 71 year old male who had a routine CBC done by his primary care physician. The blood was collected as an outpatient on a Saturday morning, and brought to our lab by a routine courier that afternoon (of course, right before change of shift!). We had one previous CBC result on this gentleman, from several years earlier, which was essentially normal. CBC result shown below:

Table 1. Case 1, CBC results. [Editor’s note: a previous version of this table noted a Hct of 231.8. The correct result is 31.8.]
Table 2. Case 1, Manual Differential results.
Image 1. Peripheral smear, Case 1, WBC 363.14.

As soon as I saw the results, I called the provider with the WBC and alerted them that I would be contacting the pathologist on call and calling back with the differential. Our pathologist confirmed blasts on the peripheral smear and requested that the sample be sent out for flow cytometry. The pathology report stated “Marked leukocytosis with left shift and <5% blasts. The presentation is suspicious for a myeloproliferative neoplasm (e.g. chronic myelogenous leukemia (CML)). Immunophenotypic studies have been ordered and will be reported separately. Clinical correlation and Hematology consult recommended.” Flow cytometry results showed left shifted maturation and FISH studies demonstrated t(9;22) BCR-ABL with 98% of positive nuclei in bone marrow. No other mutations were detected. Diagnosis: chronic myelogenous leukemia. Five days later, we had a bone marrow scheduled on a 50 year old male. A CBC done 2 weeks earlier showed a mild leukocytosis and thrombocythemia. (WBC 12.4, Hgb 17.8, Hct 52%, PLT 539). Diagnoses under consideration were possible CML, polycythemia or a myeloproliferative neoplasm (MPN). The patient’s CBC the day of the procedure is shown below.

Table 3. Case 2, CBC results.
Table 4. Case 2, Manual Differential results.

Cytogenetic analysis showed an abnormal clone characterized by the Philadelphia chromosome translocation, t(9;22). The BCR/ABL gene rearrangement was detected by FISH, with 78% of positive nuclei in bone marrow. The bone marrow was negative for other mutations. Flow cytometry analysis reported no evidence of abnormal myeloid maturation or increased blast production. There was no evidence for a lymphoproliferative disorder. Diagnosis: chronic myelogenous leukemia.

In 1959, at a time when techniques for preparing chromosomes for visualizing under the microscope were still very unsophisticated, 2 researchers in Philadelphia detected a tiny abnormality in the chromosomes of patients with CML. They noticed that part of chromosome 22 appeared to be missing. It was not until 1970, when techniques for chromosome banding became available, that this discovery was shown to be a translocation between chromosomes 22 and 9. The shortened chromosome 22 was named the Philadelphia (Ph) chromosome after the city where it was discovered.

Image 2. The Philadelphia chromosome. A piece of chromosome 9 and a piece of chromosome 22 break off and trade places (cancer.gov).

At diagnosis, over 90% of CML cases have the t(9;22) translocation which has become a hallmark for a diagnosis of CML. However, the Ph chromosome is also detected in about 30% of adult acute B cell lymphoblastic leukemia (B-ALL), and a very small number of acute myeloid leukemias (AML) and childhood B-ALL so testing must be done for differentiation. t(9;22) is a translocation of the proto-oncogene tyrosine-protein kinase ABL1 gene on chromosome 9 and the breakpoint cluster region BCR gene on chromosome 22. The newly formed chromosome 22 with the attached piece of chromosome 9 is called the Philadelphia chromosome. The BCR-ABL oncogene is formed on the Philadelphia chromosome and the product of the Ph translocation is an abnormal fusion protein, p210, which has increased tyrosine kinase activity. This, in turn, is responsible for the unregulated proliferation of cells seen in CML. Tyrosine kinase inhibitors (TKIs) have been developed as targeted therapy for Ph+ CML.1

So, how can these 2 patients with very different CBC results both be diagnosed with CML? CML can be classified into phases of CML-chronic phase (CML-CP), accelerated phase (CML-AP), and blast crisis (CML-BP). The WHO Classification of 2017 proposed a system of cutoffs to define each phase. The phases are based mainly on the number of blasts in the blood or bone marrow. Progression from CML-CP to CML-AP is also generally recognized to correlate with an increase in BCR-ABL1 levels. Several studies have been done that discuss another phase, pre-leukemic (pre-clinical) CML. These pre-leukemic patients have the Philadelphia chromosome, the genetic hallmark of CML, without other abnormalities. They have a normal to mildly elevated WBC and are asymptomatic. In these cases, progression to CML-CP can be several months to several years. One interesting factor common in this phase, which can help in diagnosis, is the presence of an absolute basophilia (ABC) >200/mm3. This basophilia is also seen in CML-CP and often progresses with the disease.2

Results from both patients are compared below. While we may more readily recognize a new CML that presents with very high WBC, left shift, and blasts, FISH, flow and cytogenetics of both these patients indicated a diagnosis of CML. This second patient may be one that could be classified as a pre-CML. The patient is certainly fortunate to have physicians who suggested further workup so he can benefit from his early diagnosis.

Table 5. Comparison of results from 2 cases.

References

  1. Huma Amin*, Suhaib Ahmed. Characteristics of BCR–ABL gene variants in patients of chronic myeloid leukemia. Open Medicine, 2021.16:904-912.
  2. Aye, Le Le; Loghavi, Sanam; Young, Ken H et al. Preleukemic phase of chronic myelogenous leukemia: 2. morphologic and immunohistochemical characterization of 7 cases Annals of Diagnostic Pathology. April 2016 21:53-58 Language: English. DOI: 10.1016/j.anndiagpath.2015.12.004.
  3. Kuan JW, Su AT, Leong CF, Osato M, Sashida G. Systematic review of pre-clinical chronic myeloid leukaemia. Int J Hematol. 2018 Nov;108(5):465-484. doi: 10.1007/s12185-018-2528-x. Epub 2018 Sep 14. Erratum in: Int J Hematol. 2018 Nov 7;: PMID: 30218276.
  4. https://www.cancer.gov/publications/dictionaries/cancer-terms/def/philadelphia-chromosome
Socha-small

-Becky Socha, MS, MLS(ASCP)CMBBCM graduated from Merrimack College in N. Andover, Massachusetts with a BS in Medical Technology and completed her MS in Clinical Laboratory Sciences at the University of Massachusetts, Lowell. She has worked as a Medical Technologist for over 40 years and has taught as an adjunct faculty member at Merrimack College, UMass Lowell and Stevenson University for over 20 years.  She has worked in all areas of the clinical laboratory, but has a special interest in Hematology and Blood Banking. She currently works at Mercy Medical Center in Baltimore, Md. When she’s not busy being a mad scientist, she can be found outside riding her bicycle.

Hematology Case Study: Unusual Lymphocytes Seen in an Apparently Healthy Young Adult

A healthy 30 year old woman visited her primary care physician concerned about a rash with questionable infection on her hands. The physician prescribed an antibiotic for infection and ordered a CBC. From the results below, it can be seen that the patient had a pancytopenia and a relative lymphocytosis.

Table 1. CBC results.
Table 2. Automated differential results

A manual differential was performed on CellaVision and the presence of large, clefted lymphocytes with immature features was noted. A request for pathology review was sent to the pathologist. The pathologist’s review stated “ Atypical lymphocytosis, specimen to be submitted for flow cytometry. Report to follow. Occasional atypical lymphocytes with immature features also noted. Lymphocyte population is predominantly mature”

The peripheral blood sample was sent out for immunophenotyping by flow cytometry and FISH studies. Flow cytology reported “precursor B-cell population expressing CD19, CD10, HLA-DR, and CD34 is identified. Percent of abnormal cells, 30%. These findings are consistent with precursor B-lymphoblastic leukemia.” While we tend to associate a leukemia diagnosis with a high white blood cell count, and the presence of blasts, this patient was unusual in that she did not have a high WBC or blasts seen on the peripheral smear. Pancytopenia in ALL has been noted in literature. A study of new onset pancytopenia in adults showed that the majority of cases were acute myeloid leukemia, but ALL and other lymphomas also caused pancytopenia3. Another study noted that “pancytopenia followed by a period of spontaneous recovery may precede the diagnosis of acute lymphoblastic leukemia.”1 While the pathologist did not identify blasts on this differential, and cells were predominately mature, WBC was very low, and our analyzer did flag “?blasts/abnormal lymphs” and reflexed the manual differential.

Image 1. Clefted lymphocytes seen on peripheral smear.
Image 2. Clefted lymphocytes on CellaVision.
Table 3. FISH report.

Leukemia is a broad term that includes a number of different chronic and acute diagnoses. Chronic and acute forms are further broken down into myeloid and lymphoid and then into subtypes. The French-American-British (FAB) classification of acute leukemias was devised in the 1970’s and 1980’s and was based on cytochemical staining and morphology of cells. These tests were performed manually and relied on what the cells look like under the microscope. The series of stains were used to differentiate myeloblasts from lymphoblasts. I’m old enough that I remember learning about these stains when they were being developed and thinking how amazing they were!

We’ve come a long way since the early 1980’s! Although the FAB diagnostic criteria are not entirely forgotten, the World Health Association (WHO) classification, first published in 2001, has largely replaced the FAB classification. The newest guidelines for Acute Lymphoblastic Leukemias (ALL) were published by WHO in 2016. These new guidelines supplement morphology and cytochemical staining with newer testing which can now identify and distinguish B cell and T cell ALL. In making a diagnosis, peripheral blood and/or bone marrow aspirate samples are subject to flow cytometry immunophenotyping and chromosome testing such as cytogenics or fluorescence in situ hybridization(FISH). Molecular tests can also be done to look for specific gene changes in the leukemia cells. The WHO classification has become preferred because these new tests can give more information that is important for treatment. Prognosis for ALL depends on patient age, WBC counts at diagnosis and these specific test results which tell us which subtype of ALL is present. The presence and identification of chromosomal alterations is important for diagnosis and therapy decisions. Identifying chromosomal alterations can also lead to better risk classification which is significant because of the knowledge that, while rearrangements tend to have poorer outcomes, some rearrangements actually offer a better prognosis. With the future era of individualized, targeted therapy for leukemia, combining conventional cytogenics with molecular and FISH methods will greatly enhance the accuracy of information and provide patients with more specific and customized treatment options.

While ALL is the most common childhood leukemia, it is not as commonly seen in adults. B cell ALL is more common than T cell ALL in all ages, and accounts for about 90% of ALL cases in children and about 75% of ALL cases in adults. Cure rates in children exceed 90% but in adults varies with age and depending on chromosomal alterations. Most B cell ALL subtypes with chromosome translocations tend to have a poorer outcome than those without translocations. As well, younger adults, <50 years old, have better prognosis than older adults.

This patient did not have a BCR/ABL rearrangement or MLL gene locus 11q23 translocation, which both carry poorer prognoses, but she also did not have a translocation between chromosome 12 and 21 or more than 50 chromosomes, both of which offer more favorable prognoses. This young woman therefore would be in an average risk category and appears to have been diagnosed very early in the course of her disease. We have not seen any further workup, as the patient is being treated at another facility. We wish her well in her leukemia treatments.

References

  1. Hasle H, Heim S, Schroeder H, et al. Transient pancytopenia preceding acute lymphoblastic leukemia (pre-ALL). Leukemia. 1995 Apr;9(4):605-608.
  2. Iacobucci I, Mullighan CG. Genetic Basis of Acute Lymphoblastic Leukemia. J Clin Oncol. 2017 Mar 20;35(9):975-983. doi: 10.1200/JCO.2016.70.7836. Epub 2017 Feb 13. PMID: 28297628; PMCID: PMC5455679
  3. Bone Marrow evaluation in new onset pancytopenia. Human Pathology. Vol 44, Issue 6. June 2013
  4. Hematology: Basic Principles and Practice, 7th Edition. Ronald Hoffman, Edward J. Benz, et al. 2018 Elsevier
Socha-small

-Becky Socha, MS, MLS(ASCP)CMBBCM graduated from Merrimack College in N. Andover, Massachusetts with a BS in Medical Technology and completed her MS in Clinical Laboratory Sciences at the University of Massachusetts, Lowell. She has worked as a Medical Technologist for over 40 years and has taught as an adjunct faculty member at Merrimack College, UMass Lowell and Stevenson University for over 20 years.  She has worked in all areas of the clinical laboratory, but has a special interest in Hematology and Blood Banking. She currently works at Mercy Medical Center in Baltimore, Md. When she’s not busy being a mad scientist, she can be found outside riding her bicycle.

Coagulation Case Study: 14 Year Old Female With a History of Bleeding Episodes

Case Study

A 14 year old female arrived at the emergency room with her mother and grandmother complaining of extremely heavy menstrual bleeding. Patient history reported by her mother included a history of “a bleeding problem” for which she had been treated a few times since age 4. Petechiae were noted on the girl’s abdomen, arms and thighs. There was no history of aspirin or other NSAID use. Blood work was ordered.

Patient results are shown in Table 1 below.

The mother called home to ask her husband for details and reported that her daughter had been diagnosed with Immune Thrombocytopenic Purpura (ITP) 10 years earlier but was not very clear on the treatments. She stated that other than frequent nose bleeds, some petechiae, and occasional bruising that the girl had seemed ok until she started menstruating. They had not seen the specialists in a number of years. Further questioning of the mother revealed that the parents had both immigrated from Iran with their families as infants. The patient was an only child. The grandmother reminisced about the village “in the old country” and mentioned that her daughter and son in law were related, the families being from the same village. When asked about any other family with bleeding disorders, the mother reported that neither she nor her husband had ever met any other relatives in Iran and were unaware of any bleeding tendencies in the family. The grandmother interjected that she did remember that several of her cousins and an uncle experienced frequent epistaxis.

The ER physician noted the normal PT/INR, APTT and slightly decreased platelet count but felt the extensive petechiae and hypermenorrhagia were out of proportion to these results. A manual differential was ordered. Differential results were within normal ranges, RBC morphology reported sight polychromasia and anisocytosis. Platelet estimate was slightly decreased with giant platelets noted. The physician suspected an inherited platelet disorder and the patient was referred to a hematologist for further workup.

Image 1. Giant platelets on peripheral blood smear.
Image 2. Giant platelets.

Discussion

I have written a few blogs about different thrombocytopenias. This case interested me because the patient was first diagnosed with ITP. ITP is an autoimmune bleeding disorder in which the immune system makes anti-platelet antibodies which bind to platelets and cause destruction. Even though the exact cause of ITP remains unknown, it is recognized that it can follow a viral infection or live vaccinations. In children this tends to be an acute disease which is self-limiting and self resolves in several weeks. However, in a small number of children, ITP may progress to a chronic ITP, as was thought to be the case in this patient.

A new hematologist saw the patient and reviewed the medical history. In this patient, the diagnosis of ITP had been followed for a short period of time in which the platelet count did not increase. She was treated with immunoglobulin. When her platelet count dropped below 30 x 103/μL, the patient was transfused several times. Early platelet transfusions increased her counts, but the patient became refractory and was then given HLA matched platelets, with some improvement. After a period of time, the patient did not return to the specialist and the parents described her condition as improved. However, as reported to the ER physician, she still experienced frequent epistaxis and other bleeding symptoms unrelated to accidental injury. The mild thrombocytopenia and giant platelets on the blood smear with normal PT and APTT in a patient with abnormal bruising or bleeding alerted the physician to the possibility of the diagnosis of Bernard Soulier Syndrome (BSS). The family history also suggested BSS.

The hematologist ordered further testing. Noted in the patients chart from 10 years ago was a prolonged bleeding time. This test was not repeated at this time because it has largely been replaced by platelet function analyzers (PFAs.) The PFA test analyzes platelet function by aspirating citrated blood through membranes to induce platelet adhesion and platelet plug formation. The test is first performed with a collogen and epinephrine membrane (Col/Epi). If the closure time is normal, platelet function can be considered normal. If the closure time with Col/Epi is increased, then the test is repeated with a collogen and ADP membrane (Col/ADP). A prolonged closure time with Col/Epi with normal Col/ADP closure time may indicate an aspirin induced platelet disorder, whereas an increased closure time with both membranes may indicate a platelet defect that is not aspirin related.3 The PFA closure times were increased in both the Epinephrine and ADP cartridges.

Platelet aggregation was normal with all agents except ristocetin. BSS can be differentiated from von Willebrand disease(vWD) by the addition of normal plasma to the ristocetin agglutination test. The addition of normal plasma adds vWF to the suspension, and in vWD the ristocetin agglutination is corrected. Agglutination with ristocetin requires vWF and GPIb/IX. Since GPIb/IX is absent or reduced in BSS, he ristocetin agglutination is not corrected in BSS, as seen in this patient.3 Flow cytometric analysis of platelet glycoproteins demonstrated reductions in CD42a (GpIX) and CD42b (Gp1bα).

Bernard Soulier syndrome (BSS), also known as Hemorrhagiparous thrombocytic dystrophy, was first described in 1948 as a bleeding disorder characterized by a prolonged bleeding time and giant platelets seen on a peripheral smear. It is an inherited platelet adhesion disorder caused by platelet glycoprotein (GP) deficiencies. The disorder is rare, affecting only about 1 in 1,000,000, though it is more common in families where parents are related. BSS is typically autosomal recessive, though a small number of cases have been found that are autosomal dominant. Most cases are diagnosed at a young age, with the autosomal dominant type often less severe and diagnosed later in life.1

Platelets are involved in primary hemostasis, the initial arrest of bleeding that occurs with vascular injury. As we know, platelets’ functions include adhesion and aggregation. Platelets first stick to the blood vessel wall (adhesion), followed by binding to each other (aggregation). In primary hemostasis, platelets first adhere to von Willebrand factor (vWF) which is bound to the subendothelial collogen fibers. This is followed by aggregation, a complex process that results in the formation of the platelet plug and the initial arrest of bleeding.. In BSS, platelet membrane GPs Ib, V and IX are missing, resulting from an inherited mutation in one of the genes that code for proteins in the complex. This affects the binding of the platelets to vWF, which subsequently interferes with primary hemostatic plug formation.4 If the platelets don’t adhere, aggregation is also affected.

Patient Results

In order to make a differential diagnosis of platelet function disorders, laboratory testing is necessary:

  • Tests of secondary hemostasis, PT and APTT, are normal in this patient so a disorder of primary hemostasis would be suspected.
  • In this patient, the platelet count was slightly decreased. In BSS, the platelet count is variable, from normal is moderately decreased, and can vary from time to time in the same patient.
  • Platelet adhesion tests (PFA) performed with both Col/Epi and Col/ADP were abnormal.
  • Light transmission aggregometry revealed platelet aggregation was normal with ADP, collogen and epinephrine. Aggregation with ristocetin was abnormal.
  • Giant platelets observed on peripheral smear
  • Flow cytometric analysis of platelet glycoproteins demonstrated reductions in CD42a (GpIX) and CD42b (Gp1bα).

Diagnosis: Bernard Soulier syndrome.

Conclusion

BSS is rare and is commonly mistaken for ITP. Reports have been published that analyze cases of BSS patients long treated as ITP. These misdiagnosed cases have been treated with immunoglobulins, steroids, IV anti-D, and other drugs used to treat refractory ITP. Splenectomies have even been reported in some cases. Platelet aggregation to ristocetin and flow cytometry have provided the correct diagnoses. Molecular studies can also be done to identify the abnormal genotype.2 Clues that can lead to a correct diagnosis are childhood ITP that does not spontaneously resolve and does not respond to treatments, other family members with bleeding problems or low platelet counts, platelet counts that are not low enough to explain bleeding or prolonged bleeding times, increased MPV and the presence of giant platelets on the peripheral smear.

This patient was diagnosed with ITP as a child, but treatments did not improve her platelets counts. She continued to have bleeding episodes which increased with the onset of menses. Her grandmother reports a history of bleeding tendencies in other family members. In addition, her parents are related. Her peripheral smears noted giant platelets. Laboratory tests confirmed a diagnosis of BSS.

Bernard Soulier syndrome (BSS) is a rare but important long-term bleeding disorder.

Patients do not require routine prophylactic treatment, so the management of BSS focuses on prophylactic treatment before certain procedures or after injuries. Patients should be advised not to take NSAIDS. The patient should be advised that treatment may be necessary prior to procedures or in response to common bleeding events such as bleeding gums, epistaxis, and menorrhagia. Antifibrinolytic therapy can be used in bleeding episodes. Platelet transfusions are considered for patients before surgery or if anti-fibrinolytics have failed. For severe cases, stem cell transplants have provided a cure. BSS may also be a candidate disorder for gene therapy in the future.1

References

  1. Grainger JD, Thachil J, Will AM. How we treat the platelet glycoprotein defects; Glanzmann thrombasthenia and Bernard Soulier syndrome in children and adults. Br J Haematol. 2018 Sep;182(5):621-632. doi: 10.1111/bjh.15409. Epub 2018 Aug 17. PMID: 30117143.
  2. Reisi N. Bernard-Soulier syndrome or idiopathic thrombocytopenic purpura: A case series. Caspian J Intern Med. 2020;11(1):105-109. doi:10.22088/cjim.11.1.105
  3. Perumal Thiagarajan, MD; Chief Editor: Srikanth Nagalla, MBBS, MS, FACP. https://www.medscape.com/answers/201722-90211/what-is-the-platelet-function-analyzer-100-pfa-100-and-how-is-it-used-in-the-workup-of-platelet-disorders
  4. Turgeon, Mary Louise. Clinical Hematology, Theory and Procedures. Fifth ed. 2012. Lippincott Williams and Wilkens. Baltimore.
Socha-small

-Becky Socha, MS, MLS(ASCP)CMBBCM graduated from Merrimack College in N. Andover, Massachusetts with a BS in Medical Technology and completed her MS in Clinical Laboratory Sciences at the University of Massachusetts, Lowell. She has worked as a Medical Technologist for over 40 years and has taught as an adjunct faculty member at Merrimack College, UMass Lowell and Stevenson University for over 20 years.  She has worked in all areas of the clinical laboratory, but has a special interest in Hematology and Blood Banking. She currently works at Mercy Medical Center in Baltimore, Md. When she’s not busy being a mad scientist, she can be found outside riding her bicycle.

Hematology Case Study: CBC with >80% Blasts

The patient is a 67 year old male who first visited his dentist at the end of December complaining of pain in the jaw that he had been experiencing since early Dec. He had put off making an appointment because he didn’t want to have to go to the doctor with COVID precautions, but the pain was now radiating to his teeth, so he made a dentist appointment. The dentist found no evidence of abscess or other infection but ‘adjusted his bite’. The patient was advised to take over the counter NSAIDs as needed or pain but no prescriptions was needed. Three weeks later the patient visited an urgent care because he had no improvement of the jaw pain. At this time he relayed symptoms of cough, fever, chills, night sweats and chronic fatigue. Patient history included an active lifestyle with vigorous aerobic exercise several times a week, but the he stated that he had been feeling too fatigued to exercise for over a month. On exam the patient was found to be tachycardic with bilateral tonsillar lymphadenopathy and oropharyngeal exudate. The patient was tested for COVID, influenza and Group A Strep. The COVID-19 was negative, as was the influenza A and B, but the Group A Strep was positive. The patient was sent home with a prescription for antibiotics.

One week later, the patient called his PCP because he still had cough, fever and chills and now was experiencing shortness of breath. The office directed the patient to go to the ER but the patient was reluctant to go to the hospital and stated he would rather be seen at the office. On review of the patients chart, the PCP agreed to see him in the office because he had had a negative COVID test in the past week. Two days later the doctor examined the patient in his office and still suspected COVID-19. He ordered a PCR COVID-19 test along with CBC/differential and erythrocyte sedimentation rate (ESR). We received a routine CBC on the patient. Results are shown below.

The patient had no previous hematology or oncology history and no previous CBC received at our lab. The critical WBC was called to the physician. Based on the WBC and flags on the auto differential, a slide was made and sent to our CellaVision (CV). On opening the slide in CV, we immediately called our pathologist for a pathology review. A rare neutrophil was seen on the peripheral smear, with immature appearing monocytes, few lymphocytes and many blasts.

Image 1. Images from CellaVision.

The pathologist reviewed the slide and the sample was sent for flow cytology studies and FISH. The pathologist’s comment ”Numerous blasts (>60%) consistent with Acute Myeloid Leukemia(AML). Specimen to be submitted for flow cytometry. Hematology consult recommended” was added to the report.

Image 2. Image from CellaVision. Predominately blasts with one neutrophil seen in field of unremarkable RBCs.
Image 3. Image from CellaVision.

The myeloid/lymphoid disorders and acute leukemia analysis by flow cytometry reported myeloblasts positive for CD117,CD33, and CD13. Final interpretation was Acute Myeloid leukemia (non-M3 type).

AML is the most common form of leukemia found in adults. AML was traditionally classified into subtypes M0 through M7, based on the cell line and maturity of the cells. This was determined by how the cells looked under the microscope after a series of special staining techniques, but did not take into account prognosis. It is now known that the subtype of AML is important in helping to determine a patient’s prognosis. In 2016 World Health Organization (WHO) updated the classification system to better address prognostic factors. They divided AML into several broad groups, including AML with certain chromosomal translocations, AML related to previous cancer or cancer therapy, AML with involvement of more than one cell type, and other AML that don’t fall into the first three groups.2 Once a case has been placed in one of these broad groups, the AML can be further classified as poor risk, intermediate risk and better risk based on other test results. Better risk is associated with better response to treatments and longer survival.3 The European LeukemiaNET (ELN) first recommended integrating molecular and cytogenic data into classification to create such a risk classification system for AML in 2010 (ELN-2010). In 2017, this was again revised (ELN-2017) to further improve risk stratification. The ELN-2017 can be used to more accurately predict prognosis in newly diagnosed AML.1

What this means is that AML is now classified by abnormal cell type as well as by the cytogenetic, or chromosome, changes found in the leukemia cells. Certain chromosomal changes can be matched with the morphology of the abnormal cells. These chromosomal changes can help doctors determine the best treatment options for patients because these changes can predict how well treatment will work.

Examples of risk classification include the knowledge that some chromosome rearrangements actually offer a better prognosis. For example, a translocation between chromosomes 15 and 17 [t(15;17)] is associated with acute promyelocytic leukemia (APL or M3). APL is treated differently than other subtypes and has the best prognosis of all the AML subtypes. Other favorable chromosomal changes include [t(8;21)] and [inversion (16) or translocation t(16;16)]. Examples of intermediate risk prognosis are ones associated with normal chromosomes and [t(9;11)]. Poor prognosis is associated with findings such as deletions or extra copies of certain chromosomes or complex changes in many chromosomes.3

The patient was diagnosed with AML, non M3 type. AML prognosis is based on CBC results, markers on the leukemia cells (flow cytometry), chromosome (cytogenic) abnormalities found and gene mutations (molecular abnormalities). In this patient the FISH studies did not demonstrate any chromosome rearrangements, which alone would place him in an intermediate risk group. In addition, our patient was over age 60 and had a WBC over 100,000/mm3 which have both been linked to worse outcomes.

Here’s one more photo for your enjoyment! It’s not often that we see so many blasts in a patient with no previous history. As a side note, I was contemplating titling this blog “Fatigue and Shortness of Breath in the Time of COVID.” I can’t help but wonder if this patient would have been diagnosed 6-8 weeks earlier if this was another year and he had been seen when he first experienced symptoms. This year, emergency rooms and physicians have reported a decrease in numbers of patients being seen for chest pain, ketoacidosis, shortness of breath, strokes and other serious conditions. Many patients are reluctant or afraid of sitting in crowded waiting rooms, fearful they will catch COVID. And many doctors are only offering virtual visits or have reduced the number of patients being seen so it is harder to get appointments. This patient expressed his reluctance to seek medical help because of fears of COVID. He did not want to go out in public and waited almost a month for symptoms to go away on their own before first being seen. After going to the walk in center, he called his PCP a week later and was still averse to going to the ER as suggested by the doctor. Then he waited another 2 days for an office appointment. The doctor still suspected COVID, but fortunately for the patient, ordered a CBC. The flow cytometry and FISH studies were available the following day. The patient was referred for hematology consult but has not been seen again at our hospital.

Image 4. More images from CellaVision.

References

  1. Boddu, P.C., Kadia, T.M., Garcia‐Manero, G., Cortes, J., Alfayez, M., Borthakur, G., Konopleva, M., Jabbour, E.J., Daver, N.G., DiNardo, C.D., Naqvi, K., Yilmaz, M., Short, N.J., Pierce, S., Kantarjian, H.M. and Ravandi, F. (2019), Validation of the 2017 European LeukemiaNet classification for acute myeloid leukemia with NPM1 and FLT3‐internal tandem duplication genotypes. Cancer, 125: 1091-1100. https://doi.org/10.1002/cncr.31885
  2. Mandel, Ananya. Acute Myeloid Leukemia Classification. Medical Life Sciences. https://www.news-medical.net/health/Acute-Myeloid-Leukemia-Classification.aspx
  3. Ari VanderWalde, MD, MPH, MA, FACP; Chief Editor: Karl S Roth, MD. Genetics of Acute Myeloid Leukemia. Medscape. Updated: Dec 17, 2018 
Socha-small

-Becky Socha, MS, MLS(ASCP)CMBBCM graduated from Merrimack College in N. Andover, Massachusetts with a BS in Medical Technology and completed her MS in Clinical Laboratory Sciences at the University of Massachusetts, Lowell. She has worked as a Medical Technologist for over 40 years and has taught as an adjunct faculty member at Merrimack College, UMass Lowell and Stevenson University for over 20 years.  She has worked in all areas of the clinical laboratory, but has a special interest in Hematology and Blood Banking. She currently works at Mercy Medical Center in Baltimore, Md. When she’s not busy being a mad scientist, she can be found outside riding her bicycle.

Hematology Case Study: A 20 Year Old with Anemia

Case History

A 20 year old Black male with a known history of HbS trait went to the primary care office for a pre-surgical evaluation for elective laparoscopic cholecystectomy for symptomatic cholelithiasis. All physical exam findings were negative. The patient had blood work completed and was found to have mild anemia with microcytosis. On previous imaging, the spleen was noted to be slightly enlarged. Further workup included a peripheral blood smear, finding target cells, microspherocytes, folded cells, and rod-shaped Hb C crystals (see image below). No sickled RBCs were noted.

Image 1. Peripheral blood smear with anemia, increased polychromatphilic RBCs, numerous target cells and rare HbC crystals

Discussion

Hemoglobin C disease is an intrinsic red cell disorder caused by Hemoglobin C (Hb C). Hb C is a variant of normal Hemoglobin A (Hb A) that results from a missense mutation in the β-globin protein, replacing the glutamic acid at position 6 with a lysine molecule. The disease can be either in the homozygous state (Hb CC) or in the heterozygous states (Hb AC or Hb SC). The origin of this mutation was traced back to West Africa and is found to confer protection against severe manifestations of malaria. In the United States, the Hb C allele is prevalent in about 1-2% of the African American population. There is an equal incidence between gender, and the incidence of the homozygous disease (i.e., Hb CC) is only 0.02%. Nevertheless, these statistics may be under-representative, since the disease is generally asymptomatic.

Heterozygous individuals with Hb AC usually show no symptoms, while homozygous individuals with Hb CC can have mild hemolytic anemia, jaundice, and splenomegaly. When Hb C is combined with other hemoglobinopathies, such as Hemoglobin S (Hb S), more serious complications can result. Hb S is similar to HbC in that it arises from a missense mutation; ie, a valine is substituted for the glutamic acid at the 6th position on the β-globin protein. As a result of this mutation, HbS abnormally polymerizes when in the presence of low oxygen tension, leaving the red blood cells (RBCs) rigid and irregularly shaped. Sickle cell disease (SCD) typically is a result of homozygous Hb S mutations (i.e., Hb SS), but the disease can also come from Hb SC.

All clinical features of Hb SS can be seen in Hb SC, including painful vaso-occlusive crises, chronic hemolytic anemia, stroke, acute chest syndrome, etc. Nevertheless, Hb SC is generally a milder disease. The complications from HbSC disease are less severe and less frequent when compared to Hb SS. Fortunately, unlike those with Hb SS disease, patients with Hb SC disease do not experience autosplenectomy, but they can develop splenomegaly. There are two complications that occur in HbSC disease occur more frequently than in HbSS disease, and they include proliferative sickle cell retinopathy and avascular necrosis of the femoral head (the latter case presents especially in peripartum women). Therefore, patients with HbSC disease should follow up with ophthalmology and obstetrics to monitor these complications. Furthermore, patients with Hb SC disease can vary in the severity of symptoms and the resulting complications. For example, some patients may develop a severe anemia and require blood transfusions; whereas, other patients are minimally affected by the disease. Overall, patients with Hb SC disease tend to have a better life expectancy compared to those with Hb SS disease. Patients with Hb SS disease have an average life expectancy of 40 years, while those with Hb SC disease are expected to live into their 60s and 70s. In contrast to Hb SS and Hb SC disease, Hb CC disease does not have an increase in mortality. As mentioned earlier, Hb CC disease results only in mild anemia, asymptomatic splenomegaly, and largely absent clinical symptoms.

Pathologic features of Hb SC and Hb CC diseases can be seen on a peripheral blood smear (PBS). Hb CC disease does not show sickled RBCs, while Hb SC can show sickled RBCs though very rarely. More importantly, Hb C is prone to polymerize into characteristic crystals. Depending on the zygosity of the individual, the crystals take on a defining shape. In heterozygous individuals (Hb SC), the crystals are found as irregular, amorphous, or bent appearing, and the RBCs can take on a “spiked and hooked” appearance. In homozygous individuals (Hb CC), the crystals are elongate, straight, and uniformly dense (as seen in the case above). In addition to crystals, the PBS shows numerous target cells, scattered folded cells, and microspherocytes.

Ancillary studies for diagnosis of these diseases include Hb variant analysis, such as electrophoresis and high-pressure liquid chromatography. Cellulose acetate (alkaline) electrophoresis is a standard method used to separate Hb A, Hb A2, Hb F, Hb C, Hb S, and other variants according to charge. Some hemoglobin variants comigrate using this described method, so citrate agar (acid) electrophoresis can be used additionally to distinguish between these variants. In Hb CC disease, analysis shows nearly all Hb C with small amounts of Hb F (i.e., fetal hemoglobin) and HbA2 (i.e., a normal variant of Hb A, in which the hemoglobin molecule is made up of 2 α chains and 2 δ chains). In Hb SC disease, analysis demonstrates almost equal amounts of Hb S and Hb C.

References

  1. Aster JC, Pozdnyakova O, Kutok JL. Hematopathology: A Volume in the High Yield Pathology Series. Philadelphia, PA: Saunders, an imprint of Elsevier Inc.; 2013.
  2. Gao J, Monaghan SA. Hematopathology. Chapter 1: Red Blood Cell/Hemoglobin Disorders. 3rd edition. Philadelphia, PA: Elsevier; 2018.
  3. Karna B, Jha SK, Al Zaabi E. Hemoglobin C Disease. 2020 Jun 9. In: StatPearls [Internet]. Treasure Island (FL): StatPearls Publishing; 2020 Jan–. PMID: 32644469.
  4. Mitton BA. Hemoglobin C Disease. Medscape, 9 Nov. 2019, emedicine.medscape.com/article/200853-overview.
  5. Saunthararajah Y, Vichinsky EP. Hematology: Basic Principles and Practice. Chapter 42: Sickle Cell Disease: Clinical Features and Management. Philadelphia, PA: Elsevier; 2018.

-Amy Brady is a 4th-year medical student at the Philadelphia College of Osteopathic Medicine. She is currently applying to AP/CP pathology residency programs. Follow her on Twitter @amybrady517.

-Kamran Mirza, MD PhD is an Associate Professor of Pathology and Laboratory Medicine and Medical Education, and the Vice-Chair of Education in the Department of Pathology at Loyola University Chicago Stritch School of Medicine. Follow him on Twitter @KMirza.

Hematology Case Study: Is it Pelger-Huët anomaly or Pseudo Pelger-Huët?

A 73 year old African American female had a CBC ordered as part of routine pre-op testing before knee surgery. The order for a CBC/auto differential and was run on our Sysmex XN-3000. CBC results were unremarkable, with the exception of a decreased platelet count. However, the instrument flagged “Suspect, Left shift?” and a slide was made for review. The CBC results are shown in Table 1 below.

Table 1. CBC results on 73 year old female.

Pelger-Huët anomaly (PHA), is a term familiar to medical laboratory professionals, but mostly from textbook images. PHA is considered to be rare, affecting about 1 in 6000 people. PHA has been found in persons of all ethnic groups and equally in men and women. The characteristic, morphologically abnormal neutrophils were first described by Dutch hematologist Pelger in 1928. He described neutrophils with dumbbell shaped, bi-lobed nuclei. The term ‘pince-nez’ has also been used to describe this spectacle shaped appearance. Pelger also noted that, in addition to hyposegmentation, there is an overly coarse clumping of nuclear chromatin. In 1931, Huët, a Dutch pediatrician, identified this anomaly as an inherited condition.

Pelger-Huët anomaly is an autosomal dominant disorder caused by a mutation in the lamina B receptor (LBR) gene on band 1q42. This defect is responsible for the abnormal routing of the heterochromatin and nuclear lamins, proteins that control the shape of the nuclear membrane.2 Because of this mutation, nuclear differentiation is impaired, resulting in white blood cells with fewer lobes or segments. In classic inherited PHA, cells are the size of mature neutrophils and have very clumped nuclear chromatin. About 60-90% of these neutrophils are bi-lobed either with a thin filament between the lobes, or without the filament. About 10-40% of total neutrophils in PHA have a single, non-lobulated nucleus. Occasional normal neutrophils with three-lobed nuclei may be seen.1 Despite their appearance, Pelger-Huët cells are considered mature cells, function normally and therefore can fight infection. It is considered a benign condition; affected individuals are healthy and no treatment is necessary for PHA.

Automated instruments may flag a left shift when they detect these Pelger-Huët cells. In this patient, the analyzer flagged a left shift and a slide was made and sent to CellaVision. The CellaVision pre-classified the Pelger-Huët cells as neutrophils, bands, and myelocytes. All of the neutrophil images were either bi-lobed or non-lobed forms. None of the neutrophils had more than 2 lobes. Eosinophils also had poorly differentiated nuclei. Cell images from this patient can be seen in Images 1-4.

Image 1. Images from CellaVision of bi-lobed “pince-nez” neutrophils with thin filament
Image 2. Non-terminally differentiated neutrophils pre-classified as bands on CellaVision. Bilobed variant without the thin filament.
Image 3. Non-lobed neutrophils with extremely coarse clumping of nuclear chromatin.
Image 4. Eosinophils in Pelger-Huët Anomaly.

If PHA is considered benign, with no clinical implications, why is it important to note these cells on a differential report? This slide was referred to our pathologist for a review. The patient had several previous CBC orders, but no differentials in our LIS. The pathologist reviewed the slide and, based on 100% of these neutrophils being affected, he reported “Pelger-Huët cells present. The presence of non-familial Pelger-Huët anomaly has been associated with medication effect, chronic infections and clonal myeloid neoplasms.” Thus, the importance of reporting this anomaly if seen on a slide. If the instrument flags a left shift, this is typically associated with infection. If these cells are misclassified as bands and immature granulocytes, with no mention of the morphology, there would be a false increase in bands reported and the patient may be unnecessarily worked up for sepsis.

An additional reason for reporting the presence of Pelger-Huët cells is that pelgeroid cells are also seen in a separate anomaly, called acquired or pseudo-Pelger-Huët anomaly (PPHA). PPHA is not inherited and can develop with acute or chronic myelogenous leukemia and in myelodysplastic syndrome. A type of PPHA may also be associated with infections or medications. Certain chemotherapy drugs, immunosuppressive drugs used after organ transplants, and even ibuprofen have been recognized as triggers for PPHA. PPHA caused by medications is typically transient and resolves after discontinuation of the drug. To add to causes, most recently, there have been studies published that report PPHA in COVID-19 patients.3

With several different causes of PHA/PPHA, a differential diagnosis is important. Is this a benign inherited condition, a drug reaction that will self-resolve after therapy is stopped, or something more serious? If Pelger-Huët cell are reported, it is important for the provider to correlate this finding with patient symptoms, treatments and history. There was no medication history and little other medical history in our case patient’s chart, and no mention of inherited PHA. The patient had also been tested for COVID-19 with her pre-op testing and was COVID negative. On initial identification of Pelger-Huët, a benign diagnosis that needs no treatment or work up would be the best outcome, so an attempt could be made to determine if the patient has inherited PHA. If other family members are known to have this anomaly, this would be the likely diagnosis as PHA is autosomal dominant. Family members can also easily be screened with CBC and manual differential. Molecular techniques are available to confirm PHA but are not routinely used. In the absence of this anomaly in other family members, it would need to be determined if the patient was on any medications that can cause pelgeroid cells. Inherited PHA and drug induced PPHA should be ruled out first because PPHA can also be predicative of possible development of CML or MDS. Considering this cause first could lead to unnecessary testing that might include a bone marrow aspirate and biopsy. Additionally, the entire clinical picture should be reviewed because in PPHA associated with myeloproliferative disorders there is usually accompanying anemia and thrombocytopenia and the % of pelgeroid cells tends to be lower.

Today most clinical laboratories have instruments that do automated differentials, and we encourage physicians to order these because they are very accurate and count thousands of cells compared to the 100 cells counted by a tech on a manual differential. Automated differentials are desirable for consistency and to improve turnaround times. Yet, it is important to know when a slide needs to be reviewed under the scope or with CellaVision. If a patient presents with a normal WBC and a left shift on the auto diff with no apparent reason, pictures can reveal important clinical information. Awareness of different causes of PHA/PPHA can relieve anxiety in patients and prevent extensive, unnecessary testing and invasive procedures.

References

  1. https://emedicine.medscape.com/article/957277-followup updated 8/4/2020
  2. Ayan MS, Abdelrahman AA, Khanal N, Elsallabi OS, Birch NC. Case of acquired or pseudo-Pelger-Huët anomaly. Oxf Med Case Reports. 2015;2015(4):248-250. Published 2015 Apr 1. doi:10.1093/omcr/omv025
  3. Alia Nazarullah, MD; Christine Liang, MD; Andrew Villarreal, MLS; Russell A. Higgins, MD; Daniel D. Mais, MD. Am J Clin Peripheral Blood Examination Findings in SARS-CoV-2 Infection . Pathol. 2020;154(3):319-329. 

-Becky Socha, MS, MLS(ASCP)CM BB CM graduated from Merrimack College in N. Andover, Massachusetts with a BS in Medical Technology and completed her MS in Clinical Laboratory Sciences at the University of Massachusetts, Lowell. She has worked as a Medical Technologist for over 30 years. She’s worked in all areas of the clinical laboratory, but has a special interest in Hematology and Blood Banking. When she’s not busy being a mad scientist, she can be found outside riding her bicycle.