The Food and Drug Administration (FDA) issued new guidance on February 29, 2020, for laboratories to be able to develop novel coronavirus (COVID-19) molecular diagnostics tests and begin use prior to obtaining Emergency Use Authorization (EUA). This permits laboratories that are CLIA certified and meet requirements to perform high complexity testing to start offering severe acute respiratory syndrome coronavirus 2 (SARS-CoV-2) molecular diagnostic testing after validation is completed as outlined in the guidance. Laboratories should submit an EUA request to the FDA within fifteen business days after validation. FDA will be hosting a webinar to provide more information on March 2, 2020, at 3 pm ET.
Clinical laboratories should contact their state health departments for guidance if they have a suspected COVID-19 case specimen. Clinical laboratories should NOT attempt viral isolation from specimens collected from COVID-19 persons under investigation (PUIs). For interim guidelines for collecting, handling, and testing clinical specimens from PUIs for COVID-19, please see the CDC Coronavirus Disease 2019 (COVID-19) website.
This month we will continue discussing the common barriers to biomarker testing for cancer patients in the community.
As you may recall, these are the top 10 barriers that I’ve seen to biomarker testing in the community:
High cost of testing.
Long turnaround time for results.
Limited tissue quantity.
Preanalytical issues with tissue.
Low biomarker testing rates.
Lack of standardization in biomarker testing.
Siloed disciplines.
Low reimbursement.
Lengthy complex reports.
Lack of education on guidelines.
As I mentioned last month sample quantity and quality are both important when considering biomarker testing. We covered tissue quantity issue last month; let’s move on to tissue quality issues. I will focus on what happens to the tissue prior to testing being performed, called the preanalytical phase of testing. We now know that preanalytical variables can alter protein structure, DNA, and RNA (1). This can alter the results that are used to diagnose and treat patients. Despite the impact to downstream assays, this area is typically poorly controlled. Some of the sources of variance due to preanalytical processes include procurement, fixation, processing, and specimen storage (1).
Procurement:
ROSE: I covered rapid onsite evaluation (ROSE) during procurement last month with regards to tissue quantity. Having a pathologist evaluate both tissue quality and sufficiency during the biopsy is invaluable. For molecular analysis, areas of necrosis should be avoided.
Fixation:
Time to get specimen into fixation (cold ischemic time): Tissue begins to degrade as soon as it is removed from the body. The amount of time between removing tissue from the body and fixing it is referred to as the cold ischemic time. This time should be as short as possible. Less than 1 hour is recommended if molecular studies are going to be performed on the specimen (1). Tissue begins degrading immediately and this degradation can affect the results of biomarker test such as IHC & FISH (1). I’ve seen cases where the biopsy was collected, but due to a busy day in the OR, it was not sent to pathology immediately. This can cause the tissue to be so degraded that testing cannot be performed. Unfortunately, sometimes we don’t know there was a fixation issue until the molecular assay fails repeatedly. This is an expensive way to determine something went wrong in the preanalytical phase.
For small biopsies such as core needle biopsies or even fine needle aspirates, one way to decrease time to get the specimen into fixative is by having the fixative in the suite where the biopsy is collected so that it is put into fixative immediately. This won’t work for large pieces of tissue that may need to be dissected for optimal fixation penetration. For these biopsies, diligence needs to be taken to get the biopsy to the laboratory as soon as possible. Multidisciplinary communication will help ensure the hand-off occurs in a timely manner. Specimens may need to be dissected for optimal fixation penetration. Other specimens may need to be decalcified prior to fixation.
Decalcification: Most decalcification processes with formic acid have negative downstream effects on molecular testing. We have about a 50% success rate of PCR actually being able to amplify DNA after standard decal due to degradation. The solution to this is to use EDTA-based decalcification; however this could lengthen the fixation time drastically. Some new gentle decals are on the market that could be used without increasing the turnaround time.
Proper Fixative: We also need to ensure specimens are fixed in the appropriate fixative. The most common and widely accepted fixative is 10% neutral buffered formalin (NBF). DNA yield and some downstream biomarker tests are negatively impacted if unbuffered formalin is used (1). Tissue fixation in alcohol such as 70% ethanol may be even better than NBF if the downstream assay involves DNA extraction; however ethanol fixation may negatively impact IHC or FISH assays (2).
Time in Fixative: Studies show that the appropriate amount of time a biopsy needs to be in fixative is about 6-72 hours (1). The wide range of times is due to the range of specimen sizes, it is generally accepted that formalin penetrates tissue at the rate of 1 mm/hour (3). Tissue may need to be dissected to ensure complete fixation within a reasonable time. If the tissue is not fixed appropriately, the tissue will degrade. However, too much time in fixative can lead to degraded DNA.
Downstream biomarker assays such as FISH, PCR, and ISH can be affected if the fixative time is greater than 72 hours (1). Small community sites that do not have someone processing specimens over the weekend may need to adjust their biopsy schedules on Fridays to ensure specimens do not sit in fixative for more than 72 hours. Unfortunately, unless the specimen is a breast biopsy, in which CAP requires fixation times to be documented and controlled, fixation times are rarely documented and controlled. This is an area we could all improve on. It would be nice to know how long a specimen was stored when we are troubleshooting a downstream assay.
Processing:
The impact of processing variables on biomarker testing has not been well published. One variable that has been called out as having a negative effect on PCR is mixing beeswax with paraffin wax. Only pure paraffin wax should be used. Other changes to the processing schedules should be performed with coordination between departments. If the anatomic pathology laboratory makes changes to their process, a verification study on the impact to the downstream assays should be performed. How extensive that study is should be determined by the medical director.
Specimen Storage:
As long as the specimen was properly fixed, FFPE block storage is normally fairly hearty. The literature recommends blocks that are used for molecular analyses be less than 10 years old (1). Although I wouldn’t recommend using blocks older than 10 years, cases positive for some biomarkers are rare, so during our validations some blocks used were over 10 years old, and the downstream PCR-based assays still worked. However, I have no way to know if the DNA yield was compromised.
Unlike FFPE blocks, long-term storage of FFPE slides does affect downstream testing (4). Room-temperature storage seems to be worse than refrigerated storage of slides. Slides should be used for IHC and biomarker testing relatively quickly (< 30 days).
Unfortunately I cannot cover all sources of preanalytical error thoroughly in a 1,000 word blog post, but hopefully this sparks your interest enough to check out the references where the authors give a more detailed explanation of preanalytical issues.
References
Bass BP, Engel KB, Greytak SR, Moore HM. A review of preanalytical factors affecting molecular, protein, and morphological analysis of formalin-fixed, paraffin-embedded (FFPE) tissue: how well do you know your FFPE specimen? Arch Pathol Lab Med. 2014;138:1520-30.
Lindeman NI, Cagle PT, Aisner DL, Arcila ME, Beasley MB, Bernicker EH, et al. Updated Molecular Testing Guideline for the Selection of Lung Cancer Patients for Treatment With Targeted Tyrosine Kinase Inhibitors: Guideline From the College of American Pathologists, the International Association for the Study of Lung Cancer, and the Association for Molecular Pathology. Arch Pathol Lab Med. 2018;142:321-46.
Howat WJ, Wilson BA. Tissue fixation and the effect of molecular fixatives on downstream staining procedures. Methods. 2014;70:12-9.
Economou M, Schoni L, Hammer C, Galvan JA, Mueller DE, Zlobec I. Proper paraffin slide storage is crucial for translational research projects involving immunohistochemistry stains. Clin Transl Med. 2014;3:4.
-Tabetha Sundin, PhD, HCLD (ABB), MB (ASCP)CM, has over 10 years of laboratory experience in clinical molecular diagnostics including oncology, genetics, and infectious diseases. She is the Scientific Director of Molecular Diagnostics and Serology at Sentara Healthcare. Dr. Sundin holds appointments as Adjunct Associate Professor at Old Dominion University and Assistant Professor at Eastern Virginia Medical School and is involved with numerous efforts to support the molecular diagnostics field.
Every so often I have the distinct pleasure of hearing of a new technology that I’d never imagined before. This last week, a study in Nature Biotechnology described using nanopore to perform protein sequencing. Thinking of the difficulty and complexity of sequencing just 4 nucleotides, it’s hard to conceive of the exponential difficulty to sequence 20 amino acids.
The technology is still in a nascent period working on the ability to differentiate 20 amino acids- some with very similar sizes and charges. However, as has been the case with many technologies, the speed of advancement can increase rapidly. The possibilities of this technology are very exciting.
Figure 1. Aerolysin structure from CyroEM. This pore comes from Aeromonas hydrophila, a Gram-negative bacterium associated with diarrheal diseases and deep wound infections.
Nanopores have been used mostly for sequencing DNA. Pacific Biosciences have created a platform that reads long sequences of DNA by synthesizing DNA from a single strand moving through a pore. Another company, Oxford Nanopore has made several devices that use nanopore technology to perform sequencing in portable devices. The key to most of these technologies involve functionalizing the pores to have properties desirable for specific purposes.
For protein sequencing, amino acids need to move through the pores slowly enough to have their charges accurately measured. To accomplish this goal, the French start-up, DreamPore, used a bacterial derived cytolytic pore called aerolysin. Aerolysin was found to slow down the passage of amino acids as it has a single molecule trap, which binds to single amino acids with carrier cations. This method detects 13 of the20 amino acids. Additional chemical modifications, instrumentation advances, and nanopore imaging allowed two additional amino acids to be detected. The last few were too similar in charge to be differentiated. However, this study provides a path forward where it is conceivable to sequence each of the 20 amino acids.
In the future, detecting post-translational modifications such as glycosylation and phosphorylation will be an important advance. It will be fun to follow the progress of this technology to see how it might be applied clinically.
References
Iacovache I, De Carlo S, Diaz Nuria et al. Cryo-EM structure of aerolysin variants reveals a novel protein fold and the pore-formation process. Nature Communications 2016. 7:12062.
Ouldali H, Sarthak K, Ensslen T et al. Electrical recognition of the twenty proteinogenic amino acids using an aerolysin nanopore. Nature Biotechnology 2020; 38: 176-181
-Jeff SoRelle, MD is a Chief Resident of Pathology at the University of Texas Southwestern Medical Center in Dallas, TX. His clinical research interests include understanding how the lab intersects with transgender healthcare and improving genetic variant interpretation.
As you may recall last month I shared common barriers to biomarker testing for cancer patients in the community. I also began to dive-in to a few solutions that I have seen implemented to overcome the barriers. Last month I shared solutions that may help with high cost and long turnaround times for biomarker testing. This month I would like to discuss issues with tissue including quantity.
Here are the top 10 barriers that I’ve seen to biomarker testing in the community:
High cost of testing.
Long turnaround time for results.
Limited tissue quantity.
Preanalytical issues with tissue.
Low biomarker testing rates.
Lack of standardization in biomarker testing.
Siloed disciplines.
Low reimbursement.
Lengthy complex reports.
Lack of education on guidelines.
Sample quantity and quality are both important when considering biomarker testing. If we don’t have enough material we cannot perform the test (quantity not sufficient or QNS). If we have poor quality we cannot trust the results. The old adage of garbage in garbage out holds true for biomarker testing just as it does for all other lab tests.
I’ll start with sample quantity this month and cover quality issues next month. The issue here is that a variety of biopsy types are performed on patients depending on the location and size of a suspicious mass. Historically we only needed enough material for the pathologist to make a diagnosis. Now we often need enough material for diagnosis and biomarker testing. Some tumor types such as breast and ovarian cancers produce enough material in locations that are easily accessible that tissue quantity is rarely an issue, however other tumor types such as lung and pancreatic cancers there is often an issue with tissue quantity. These tumor types must be handled with care to ensure no tissue recovered is lost.
The first step in addressing tissue insufficiency is knowing where you are starting. Do you have an issue with quantity not sufficient (QNS) rate? If you don’t know how many of your cases are insufficient for biomarker testing, then you can’t determine if you have an issue. If your testing is performed at a reference laboratory, you can request your QNS rate from the lab. They may also be able to provide you with the national QNS rate and then you could benchmark yourself against your peers. It is important to have an accurate QNS rate, so if there are blocks that are not sent to the reference lab because the pathologist has determined the block to be exhausted (no tissue is left) then the QNS rate provided by the reference lab may be artificially low.
It is important to agree upon what is QNS. We consider a specimen to be QNS if we cannot perform biomarker testing on the block. Others may consider the block QNS only if there wasn’t sufficient material for diagnosis. We have to ensure there is enough tumor content in the tissue to proceed with biomarker testing, in our case 10% of the nucleated cells (not volume) must be tumor (determined by pathology review of an H&E slide). If we have enough tumor, we can still end up with a QNS block due to low DNA and RNA yield. So we need sufficient tumor and sufficient tissue.
Here is a brief overview of solutions I have seen work to address limited tissue that can lead to high QNS rates:
Education. The person collecting the biopsy needs to understand how much material is needed. Remember we have moved the goal post. Sufficient material for diagnosis was enough in the past, now we need more material to perform biomarker testing. Educating the team on why we need more material is valuable in ensuring sufficient material is collected.
ROSE. Rapid onsite evaluation (ROSE) by a pathologist in the procedure room to determine sufficiency has been shown to decrease the repeat biopsy rate [1]. The pathologist can ensure the biopsy is being collected in a tumor rich region and help ensure areas of necrosis are avoided.
Embedding cores separately. We often get core needle biopsies on lung cancer specimens. We prefer 3-5 cores. It is best practice to independently embed the cores in separate blocks. I have also seen labs that embed no more than 2 cores in one block. This would allow one block to be conserved for diagnosis and the other to be used for biomarker testing.
Visual cue for limited tissue. Someone far more creative than me developed a process in histology where in cases of limited tissue the tissue was embedded in a red cassette. This cassette color was a visual cue for everyone handling the block that the tissue was limited and care should be taken when facing into the block. This has evolved over time to a red bead being embedded beside the tissue. Any visual cue and an associated procedure to ensure tissue conservation can help ensure we are conserving tissue in cases where it matters.
Limited IHC Stains. The primary reason a biopsy is performed is for diagnosis. It is recommended that as few IHC stains as possible be used to make the diagnosis. This will conserve tissue for biomarker testing.
Unstained Slides. Cutting 15-20 unstained slides is considered best practices in tumor types such as lung where biomarker testing will be performed within 30 days. Long term storage of unstained slides is not recommended.
Reduce the number of times the block goes on the microtome, because every time the block is put back on the microtome it must be refaced. This results in wasted tissue. This can be prevented by thinking ahead and cutting everything you know will be needed while the block is on the microtome.
References
Collins BT, Murad FM, Wang JF, Bernadt CT. Rapid on-site evaluation for endoscopic ultrasound-guided fine-needle biopsy of the pancreas decreases the incidence of repeat biopsy procedures. Cancer Cytopathol. 2013;121:518-24.
-Tabetha Sundin, PhD, HCLD (ABB), MB (ASCP)CM, has over 10 years of laboratory experience in clinical molecular diagnostics including oncology, genetics, and infectious diseases. She is the Scientific Director of Molecular Diagnostics and Serology at Sentara Healthcare. Dr. Sundin holds appointments as Adjunct Associate Professor at Old Dominion University and Assistant Professor at Eastern Virginia Medical School and is involved with numerous efforts to support the molecular diagnostics field.
This past November, I was lucky to attend the Association for Molecular Pathology (AMP) annual meeting held in Baltimore, MD. It was the 25th Anniversary of the association and it was interesting to see how it had grown over time. I went to a session moderated by members that had seen AMP in its infancy and it was remarkable to hear how the first meeting was a group of people that could fit in one of the small conference rooms, and how it had grown to offering this meeting for hundreds of people from all around the world. They have been on the forefront of the field of Molecular Diagnostics and have worked hard for many causes affecting those in the field. They discussed important events in the history of the association, such as when AMP, along with other groups, sued Myriad Genetics, Inc, on the practice of gene patenting. Myriad had filed patents for the BRCA1 and BRCA2 genes, and thus they were the only ones who could test those genes for patients. The Supreme Court ultimately ruled that genes are products of nature, which cannot be patented, and this has led to an increase in choice for patients. This, among many other activities, is the way AMP continues to impact the field. They even had a Day of Advocacy the day before the annual meeting began when a group traveled to nearby Washington D.C. to visit with lawmakers about current issues.
If you are a technologist working in a Molecular lab, this meeting is, I believe, the most relevant one for any technologist to attend. If you are not a member of AMP, consider this a shameless plug for membership. The great thing about it is that the association really does its best to be for every one of its members. At the annual meeting, there are sidebars for each type of member, from technologist to trainees, to pathologists. I attended a lunch for trainees and technologists that included two speakers that described their journey through their different careers in the field. They were available to speak with after the session as well. I also attended an informal talk on the exhibit floor that explained the tools available for technologists through AMP, such as the technologist list serve, where I can email every technologist on the membership list for AMP if I have any questions or issues. They also described the website that guides techs to different types of certification tests and links to study guides. These were both great places to network with other technologists as well. The best thing about a technologist membership? It’s discounted compared to the pathologist membership – it’s only $75 a year and provides access to an account that has continuing education opportunities, as well as a digital subscription to the Journal of Molecular Diagnostics. Besides my membership to ASCP, I believe being an AMP member is key to staying up to date in this amazing field.
-Sharleen Rapp, BS, MB (ASCP)CM is a Molecular Diagnostics Coordinator in the Molecular Diagnostics Laboratory at Nebraska Medicine.
We are seeing an unprecedented amount of new targeted therapies for cancer treatment that are tied to diagnostic tests. Drug companies are heavily invested in ensuring the right patients get the right therapy. This is because it actually benefits pharma companies and patients. Patients get a very specific therapy that will likely improve their survival rate and improve their quality of life. By being selective and targeting only patient populations that are likely to respond based on the biology of their tumor, pharma companies show improvements over existing therapies which supports their request for FDA-approval.
With every pharma company tying their drug to specific rare biomarkers, broad molecular profiling such as NGS becomes more important than ever. We will never find the needle in the haystack if we don’t examine the entire stack. However, most cancer patient care occurs in the community where NGS testing is not usually offered locally. There are specific barriers to biomarker identification in the community setting. I will take the next few months to discuss specific barriers and how a lab might overcome these obstacles in order to increase patient access to precision medicine. Just as no barrier is identical between institutions, no solution will be one-size fits all. Feel free to cherry pick and modify solutions that you feel would address your local issues. Remember don’t let perfect be the enemy of the good. Small incremental improvements are impactful and generally require fewer resources than trying to revamp your entire process.
Here are the top 10 barriers that I’ve seen to biomarker testing in the community:
High cost of testing.
Long turnaround time for results.
Limited tissue quantity.
Preanalytical issues with tissue.
Low biomarker testing rates.
Lack of standardization in biomarker testing.
Siloed disciplines.
Low reimbursement.
Lengthy complex reports.
Lack of education on guidelines.
This month I will address the first two barriers that I commonly see with respect to biomarker testing. Molecular testing is expensive and turnaround time is often long. This was especially true for technology such as NGS. There are a few solutions to the high cost and long turnaround time for molecular testing that I’ve seen work well.
Solutions to costly molecular testing such as NGS:
Insource NGS testing.
Continue to send-out but renegotiate your contracts with reference laboratories to ensure pricing is as low as possible.
Let’s dig into the decision to insource NGS versus continuing to outsource testing. It’s easy for me to say insource the test and describe the benefits of doing so, but if your volume is low and you don’t have the facility or expertise, this solution is not likely to work for you. There is a new platform coming to market that claims to make it easier to insource NGS without extensive molecular expertise, however the company will need to provide data to support that claim. If they do show they can provide NGS testing with less expertise, then this could be a game changer for community labs looking to insource NGS testing.
The benefits of insourcing testing include decrease cost of providing biomarker testing, decreased turnaround time on testing, and local provider input into the test menu. Some of the things that we considered when deciding to insource NGS was the cost to perform NGS testing versus sending it out, volume of specimens to be tested, expertise required, facility requirements, ease of workflow, did available panels meet our clinician and guideline needs, and if there was a comprehensive pipeline available from the vendor. We found a solution that fit our needs in all of these buckets.
After determining that insourcing NGS was the right thing to do for our health system we had to secure funding for the project. We prepared a business case using reference laboratory cost avoidance. This is an example business case for a NGS project:
Imagine that you currently send out 200 NGS tests per year for the same panel.
This reference lab NGS panel costs $3500 per sample.
You calculate that by insourcing the testing you can perform the test for $600 per sample (fully loaded with tech time, repeat rate, control cost, validation cost, QA cost, overhead).
This would save the health system $580,000 per year [($3500-$600)X(200 tests)].
Pretend the instrumentation required to perform the test in house cost $300,000.
Even the first year, the project could save the health system $280,000 ($580,000-$300,000). Subsequent years would be even more favorable. Showing a favorable return on investment (usually within a 5 year time period) would make it easy for the C-suite to approve insourcing this project.
Obviously money is not the only deciding factor when insourcing testing. I have to be able to perform a test cheaper, faster, and at least as well as the reference laboratory if not better or I will not insource a test.
There are a variety of reasons that you may not want to insource NGS testing. You may not have the expertise, facility, or volume for it to make sense to insource the testing. Are you stuck paying whatever your reference lab is charging you because you can’t in source the test? No.
If you have not negotiated the pricing and billing structure of your molecular pathology reference lab recently, it may be time to take a look around. Here are a few things to consider getting better pricing on send out testing:
Renegotiate. You can try to renegotiate with your current reference lab to decrease your contracted price.
Shop around. The molecular pathology lab market is growing. With competition comes better pricing.
Increase volume. You could try to standardize which lab your physicians are using to increase the volume to your reference lab. Most reference lab contracts are negotiated based on volume. So if you can increase the volume, it is likely that you can decrease the price you’re paying.
Direct billing. It is worth addressing who is billing the patient (and who has the highest risk of being stuck with the bill if the testing is not covered). Many molecular pathology labs now directly bill the patient (as long as the patient was not an inpatient within the last 14 days). You may want to explore this option when negotiating contracts.
Insurance coverage. You should also consider whether the test offered by the lab is approved for coverage by your most common payers.
Out of pocket costs. Many labs now have maximum out of pocket costs to patients that are reasonable. This ensures your patients are stuck with large bills.
Whether you decide to insource or continue to outsource NGS testing, there are options that could decrease the cost and turnaround time for biomarker testing.
-Tabetha Sundin, PhD, HCLD (ABB), MB (ASCP)CM, has over 10 years of laboratory experience in clinical molecular diagnostics including oncology, genetics, and infectious diseases. She is the Scientific Director of Molecular Diagnostics and Serology at Sentara Healthcare. Dr. Sundin holds appointments as Adjunct Associate Professor at Old Dominion University and Assistant Professor at Eastern Virginia Medical School and is involved with numerous efforts to support the molecular diagnostics field.
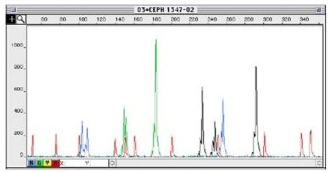
Molecular diagnostics tests come in many forms, but one of the simplest assays is a fragment based assay. The principle of such an assay is to perform polymerase chain reaction (PCR) on a segment of DNA. If there is a mutation, the PCR fragments will be different in size. Notably, this method is good for detecting mutations that cause the insertion or deletion of multiple nucleotides. This type of assay is not suitable for single base pair changes or small insertion/ deletions.
The fragment size is analyzed by labeling the PCR products with a fluorescent dye and then running them through a Sanger capillary sequencer. The fragments will be separated based on size and ideally give clean peaks with low background (Figure 1).
Figure 1. Sample fragment analysis plot (x-axis is time, y-axis is fluorescence intensity) with smaller fragments coming off earlier (more to the left on x-axis). Red peaks represent the molecular size ladder for calibration. Other colors represent fragments labeled with other fluorophores. The ladder also helps you ensure that fragments of different lengths are coming off of the analyzer at similar levels.
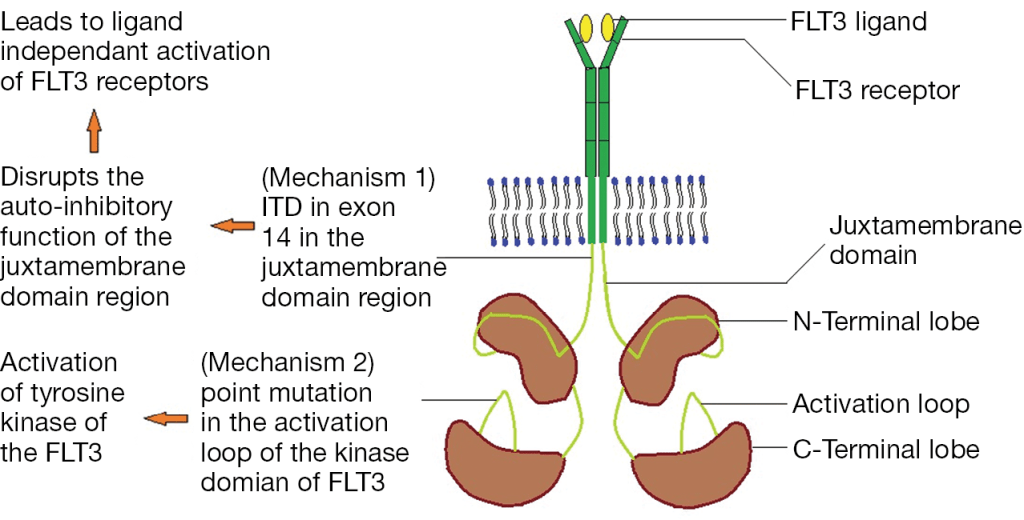
One common application of this assay type is to detect FLT3 internal tandem duplications (ITD). FLT3, Fms Related Tyrosine Kinase 3, is a tyrosine kinase growth factor receptor for FTL3-ligand, and regulates hematopoiesis. Mutations in FLT3 are found in 1/3 of Acute Myeloid Leukemia cases and confer a worse prognosis. FLT3 mutations lead to ligand-independent activation by either disrupting the auto-ihibitory loop of the juxtamembraneous domain through an ITD mutation or by an activating point mutation in the tyrosine kinase domain (TKD) (Figure 2).
Figure 2. Mechanisms of FLT3 activating mutations through internal tandem duplication (ITD) in the juxtamembraneous domain or activating point mutations in the tyrosine kinase domain (TKD).
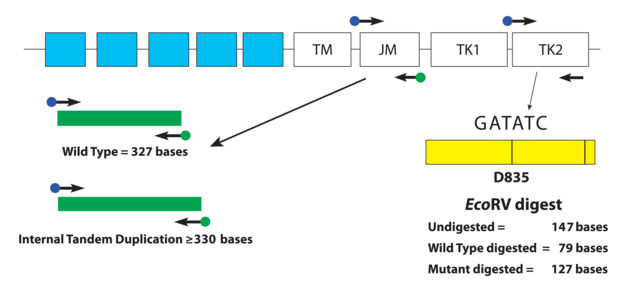
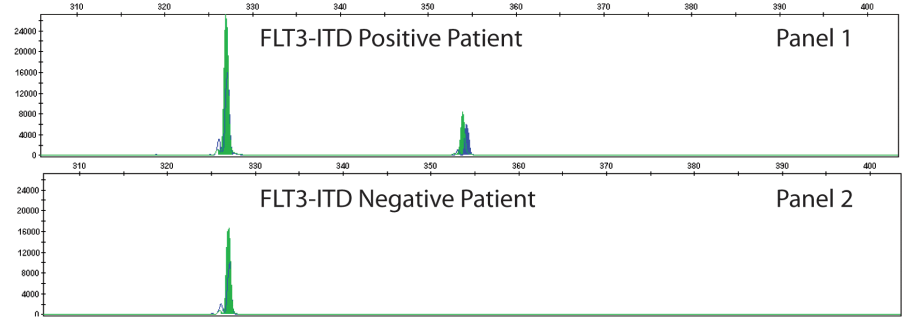
The type of FLT3 mutation is also important as there are tyrosine kinase inhibitors (TKI’s) that are being investigated for use in FTL3+ cases. Type I inhibitors bind FLT3 in the active conformation either in the ATP binding pocket or at the activation loop; these inhibitors are useful for both ITD and TKD mutations. However, Type II inhibitors bind inactive FLT3 near the ATP binding domain, so they affect ITD but not TKD mutations.As the site of ITDs is consistently in exons 14 and 15 of FLT3, primers flanking this region were designed to detect any mutations in this area (Figure 3). As some artifacts can arise from the PCR process and create false positive peaks, a green primer labels PCR products from one direction and a blue primer labels PCR fragments from the other direction, therefore enhancing specificity (Figure 4). A wild type (WT) sequence will thus be 327bp in either direction.
Figure 3. Depicted is a representation of the FLT3 JM region and the activating loop of the kinase domain. Green and blue dots with black arrows represent the relative positions of primers that target the JM region for ITD and yellow dots with black arrows represent the relative positions of the primers that target TKD mutations in the activating loop of the kinase domain. The yellow box has vertical black lines that represent the position of the wild-type EcoRV restriction digest sites. Image adapted from InVivoScribe.Figure 4. A FLT3-ITD positive case is shown on the top with a longer segment present with both green and blue peaks present confirming a larger PCR product size. This mutation is present in only minority of cells that represent the aberrant AML population. Image adapted from InVivoScribe.
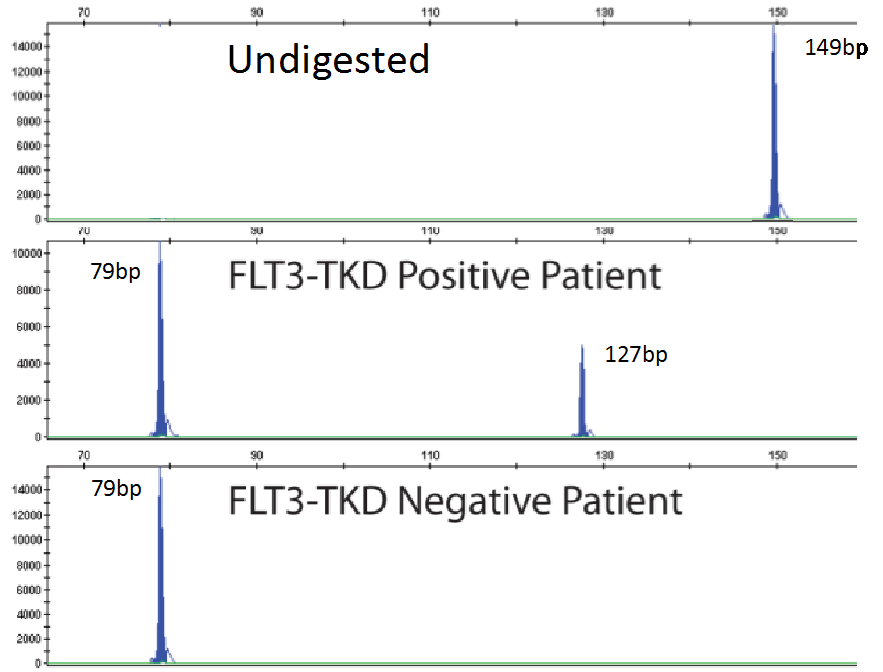
As mentioned previously, fragment analysis is not suited to detecting point mutations as would be found for TKDs. However, the FLT3 assay has overcome this issue. Investigators determined that the TKD point mutation at codon D835 disrupts the endonuclease recognition site of the enzyme ecoRV (Figure 3). Customized primers again produce a unique PCR fragment (149bp long), which when digested with ecoRV will produce a 79bp fragment in wild type FLT3. If a FLT3-TKD mutation is present the ecoRV will not cleave the fragment at this location, but another ecoRV cleavage site (right side of yellow box) will create a 127bp fragment (Figure 5). Without this second cleavage site, an enzyme failure could be interpreted as a mutation. Thus, the enzyme, ecoRV, must be active and only functional at a single site to produce a TKD mutation.
Figure 5. Panels representing PCR fragments that are undigested by ecoRV (top), digested and have a TKD mutation present (middle) and no TKD mutation detected (bottom). Image adapted from InVivoScribe.
References
Daver Naval, Schlenk RF, Russell NH, and Levis MJ. Targeting FLT3 mutations in AML: review of current knowledge and evidence. Leukemia 2019; 33:299-312.
Pawar R, Bali OPS, Malhotra BK, Lamba G. Recent advances and novel agents for FLT3 mutated acute myeloid leukemia. Stem Cell Invest. 2014; 1(3). doi: 10.3978/j.issn.2306-9759.2014.03.03
-Jeff SoRelle, MD is a Chief Resident of Pathology at the University of Texas Southwestern Medical Center in Dallas, TX. His clinical research interests include understanding how the lab intersects with transgender healthcare and improving genetic variant interpretation.
There are often new buzzwords flying around that everyone uses, but few actually understand what they mean. Personalized and precision medicine are two of these terms that are often used interchangeably. Every lab wants to say they are performing personalized medicine. And to be fair we really do all provide personalized medicine in some form. Almost all lab results are used to customize the treatment for patients. However these buzzwords are used to refer to tests that describe linking genetic, lifestyle, or environmental information with predicted response to treatment. Precision medicine may be the more accurate term to describe identifying effective treatment for the right patient at the right time based on genetic, lifestyle, or environmental information. The term personalized medicine may give the false impression that therapies were developed specifically for the patient, when really they are developed to target a specific genotype or phenotype.
One example of precision medicine being used clinically today
is in oncology. Many cancer drugs now require an associated test to determine
the presence or absence of a specific biomarker to determine which patients are
likely respond to the therapy. The biomarker tests that are linked to a
specific therapy are called companion diagnostics. Biomarkers analyzed can be a
specific protein or gene such as programmed death ligand-1 (PD-L1) or epidermal growth factor receptor (EGFR) or they can be much broader such
as tumor mutational burden (TMB) or immune signatures. Identifying biomarkers that
determine which patients are likely to respond to therapy and only giving
patients with the biomarker the drug increases response rates to the therapy
and may decrease side effects. More than half of the clinical trials for cancer
drugs in 2018 were linked to a specific biomarker. Linking drug selection with
specific laboratory tests is causing an increased need for multidisciplinary
collaboration among pathology, oncology, and the laboratory.
In our lab we perform precision medicine using PCR or NGS
assays to analyze patient’s tumor for specific genes. Although we still perform
single gene testing when ordered, most of our cases are analyzed by a NGS
panel. NGS panel testing allows us to look at numerous biomarkers with one
test. This decreases the cost, time and tissue utilized to determine the
patient’s biomarker status. Our NGS panel analyzes 52 genes to look for
mutations that would indicate a patient is likely to respond to a targeted
therapy. Most of our oncology testing is done on lung, colon, and melanoma
specimens, although the panel is validated for most solid tumors. The report
that we issue the oncologist provides clear information on which therapies the
patient is likely to respond to or likely to be resistant to based on their
tumor’s genetic profile. We also include information in the report to match
patients to clinical trials. Precision medicine utilizing panel NGS testing for
predicted response to treatment is becoming standard of care for many solid
tumors.
-Tabetha Sundin, PhD, HCLD (ABB), MB (ASCP)CM, has over 10 years of laboratory experience in clinical molecular diagnostics including oncology, genetics, and infectious diseases. She is the Scientific Director of Molecular Diagnostics and Serology at Sentara Healthcare. Dr. Sundin holds appointments as Adjunct Associate Professor at Old Dominion University and Assistant Professor at Eastern Virginia Medical School and is involved with numerous efforts to support the molecular diagnostics field.
The following case is an interesting overlap of
Hematopathology and Molecular Diagnostics, and shows the utility of sequencing
to detect a cancer before biopsy could.
A 63 year old gentleman presented to a heme/onc physician
with six months of intractable anasarca, fatigue, and a recent mild
thrombocytopenia (Table 1). They were otherwise in healthy condition. The
physician initiated a lymphoma work-up that included a bone marrow biopsy. The
tests were negative for M-protein.
Table 1. Summary of symptoms and relevant abnormal labs.
The bone marrow biopsy was somewhat limited, but the core contained multiple marrow elements. After a thorough review by a Hematopathologist, no evidence of dysplasia or other irregularities could be detected (Image 1). Flow cytometry detected no aberrant blast population. Cytogenetics detected 20del [16/20] and 5del [3/20]. These findings did not clearly indicate a specific diagnosis.
Image 1. 40x view of the bone marrow specimen at the initial presentation. No evidence of dysplasia was found.
As the clinical suspicion for a malignancy was high, the
bone marrow specimen was sent for sequencing on a 1385-gene panel test. The
test included tumor-normal matched DNA sequencing (“tumor” sample: bone marrow,
normal: saliva), RNA whole transcriptome sequencing on the bone marrow, and
Copy Number Variant (CNV) analysis. Tumor-normal matched sequencing helps rule
out variants that are normal and present in the patient.
Somatic mutations were determined as those that were present
in the “tumor” sample and not in the matched normal sample. The somatic
variants found are listed below with their variant allele frequency (VAF) in
parenthesis. Recall that a VAF of 40% means that a mutation is present in the
heterozygous state in 80% of cells.
IDH2 (p.R140Q, 46%)
SRSF2 (p.P95T, 51%)
CBL (p.R499*, 47%)
KRAS (p.K117N, 12%)
Figure 1. View of IGV, which displays the NGS reads for IDH1 along with the variant allele highlighted in red. The color of the bars indicates the direction of the reads (forward in red and reverse in blue). This reflects the allele frequency of approximately 50%.
The mutations in these genes are commonly found in myeloid
cancers including myselodysplastic syndrome. Activating mutation in IDH2 (isocitrate dehydrogenase 2)
increase the production of the oncometabolite 2-HG, which alters methylation in
cells taking them to an undiffereitiated state. SRSF2 (Serine And Arginine Rich Splicing Factor 2) is a part of the
spliceosome complex, which regulates how sister chromatids separate from each
other. Failures in the proper function of the complex creates genomic
instability. CBL (Casitas B-lineage
Lymphoma) is a negative regulator of multiple signaling pathways, and loss of
function mutations (as seen here) lead to increased growth signals through
several tyrosine kinase receptors. KRAS
(Kirsten RAt Sarcoma virus) is an upstream mediator of the RAS pathway, which
acquires mutations that lead to constitutive activation and sends growth
signals to cells causing them to proliferate.
Furthermore the CNV analysis
also found the heterozygous loss of chromosome 20 as reported in cytogenetics.
CNV analysis did not detect chromosome 5 deletion, as it was below the limit of
detection (20% for CNV analysis).
Figure 2. This plot shows the normalized read frequency of genes across each of the chromosomes is shown here. The drop at chromosome 20 is shown in a pale brown color on the right side of the graph. This is consistent with the cytogenetic findings. The loss of 5q isn’t seen as it is below the limit of detection of 30%.
These mutations are all individually common in MDS, but the co-occurance of each gives very strong evidence that MDS is the diagnosis (Figure 3). There have also been studies that provide prognostic implications for several of the genetic mutations present. Some mutations like SRSF2 or CBL at high VAF (>10%) indicate a poor prognosis, but mutations in IDH2 or TP53 at any frequency have not only a high chance of progression, but also a faster time to onset of disease. Another non-genetic risk factor for developing MDS is an elevated RDW, which we saw in our patient.
Figure 3. From Becker et al 2016.
All of these high-risk factors together led us to push for a diagnosis of MDS based off of molecular findings, and the patient was started on treatment with Azacitadine. Our assessment was confirmed 3 months later when, the patient’s follow up bone marrow biopsy showed significant progression with megakaryocytic and erythroid dysplasia and hyperplasia and reticulin fibrosis MF2 (Image 2). Aberrant blasts were detected (1-2%), but not elevated. This demonstrates how molecular findings predicted and predated the patient’s rapid progression to morphologic disease.
Image 2. Dysplastic, hyperplastic megakaryocytes and erythroid lineage.
In summary, multiple molecular mutations indicative of MDS
were found in a symptomatic patient’s unremarkable bone marrow biopsy months
before a rapid progression to MDS.
References
Steensma DP, Bejar R, Jaiswal S et al. Blood 2015;126(1):9-16.
Sellar RS, Jaiswal S, and Ebert BL. Predicting progression to AML. Nature Medicine 2018; 24:904-6.
Abelson S, Collord G et al. Prediction of acute myeloid leukemia risk in healthy individuals. Nature 2018; 559:400-404.
Desai P, Mencia-Trinchant N, Savenkov O et al. Nature Medicine 2018; 24:1015-23.
Becker PM. Clonal Hematopoiesis: The Seeds of Leukemia or Innocuous Bystander? Blood.2016 13(1)
-Jeff SoRelle, MD is a Chief Resident of Pathology at the
University of Texas Southwestern Medical Center in Dallas, TX. His
clinical research interests include understanding how the lab intersects
with transgender healthcare and improving genetic variant
interpretation.
I first started in my
current lab back in 2008. At that time, we did not have a separate section for
testing solid tumors in our lab. The small amount of testing we did have were
for three different types of sarcomas, and we still used a thermal cycler that
didn’t have a heated lid, so we had to put mineral oil over the top of the
reactions…
Fast forward eleven
years and we now have a “bench” dedicated to solid tumor testing with next
generation sequencing as a major part of this testing. We have been running our
current solid tumor assay, a hotspot panel of fifty genes, for almost five years
now and it has served us well. However, many of our oncologists have been
starting to ask for more. We have begun the search for a larger panel to
fulfill the needs of our oncologists and our patient population. As a smaller
lab, we are somewhat limited in resources and are not quite ready to go
completely custom, so we are left with kitted options from major vendors. As we
research and evaluate these options, though, certain questions come to light. These
panels have more than 150 genes and upwards of 500 genes in order to cover the
most relevant genes in a number of different cancers. The areas tested in these
genes are important for therapy and/or prognosis, but with the sheer number of
bases we are looking at, we are bound to find many variants that do not have a
known significance.
So, question one, how
do the pathologists deal with trying to interpret the large number of variants
of unknown significance (VUS’s)? Currently, with our very limited 50 gene
panel, we may get one or two VUS’s, so it doesn’t take much time to assign
significance and sign out the report. Our myeloid panel, which is a larger
panel of 40 genes, some with full gene coverage, though, can sometimes result
in reports with eight to ten VUS’s. These reports take a lot of time to
research the potential impact each of these variants will have in the disease. I
have seen reports from some of these large gene panels that have upwards of 25
or more VUS’s detected in a single specimen. How are these handled in the pathologists’
workflow? Can time be taken to investigate each of these, or are they just
placed in a list in the report?
Question two, how do
the oncologists feel when they receive a report with few, if any, variants with
known significance, and many variants with unknown significance? Does this help
at all, or make it more difficult and frustrating? I’d be interested if anyone
has feedback in this area. In our internal tumor boards, when we review testing
done at other locations, a great deal of time is spent trying to filter through
the results to see how they can help point to the best possible treatment for
the patient. If the variants do not point to therapy or clinical trials, those
variants are not currently helpful.
Lastly, if and when we bring up a larger panel, do we keep running our smaller 50 gene panel? We believe the answer to this one is easy – yes. The amount of DNA needed for some of these larger panels is more than what we can get sometimes from the smaller biopsies. Also, insurance may not always cover the larger panels. The information we get from the 50 gene panel is still very useful and can point the oncologists to therapy options, as well as clinical trials, so we believe the smaller panel will still have a place in our lab.
-Sharleen Rapp, BS, MB (ASCP)CM is a Molecular Diagnostics Coordinator in the Molecular Diagnostics Laboratory at Nebraska Medicine.