BETHESDA, MD. — June 28, 2016 — The College of American Pathologists (CAP), the International Association for the Study of Lung Cancer (IASLC), and the Association for Molecular Pathology (AMP) announced today the open comment period for the revised evidence-based guideline, “Molecular Testing Guideline for Selection of Lung Cancer Patients for EGFR and ALK Tyrosine Kinase Inhibitors.”
The open comment period begins today and will close on August 2, 2016. The online format provides an opportunity for public review of new draft recommendations for several key topics, as well as recommendation statements that have been reaffirmed since the initial guideline was jointly published online in April 2013 by Archives of Pathology & Laboratory Medicine, The Journal of Thoracic Oncology, and The Journal of Molecular Diagnostics.
The guideline revisions are designed to provide state-of-the-art molecular testing of lung cancer recommendations for pathologists, oncologists, and other cancer and molecular diagnostic laboratory professionals. The revisions are all based on evidence from an unbiased review of published experimental literature since 2013 and include the recommendations from an expert panel of renowned worldwide leaders in the field. The final recommendations will be approved and jointly published after consideration of the public comments, further panel discussion, and a complete evidence analysis. For more information and to provide comments, visit www.amp.org/LBGOCP.
Stringency is a term that many molecular technologists are all very familiar with. It is a term that describes the combination of conditions under which a target is exposed to the probe. Typically, conditions that exhibit high stringency are more demanding of probe to target complementarity and length. Low stringency conditions are much more forgiving.
If conditions of stringency are too HIGH → Probe doesn’t bind to the target
If conditions of stringency are too LOW → Probe binds to unrelated targets
Important Factors That Affect Stringency and Hybridization
Temperature of hybridization and salt concentration
Increasing the hybridization temperature or decreasing the amount of salt in the buffer increases probe specificity and decreases hybridization of the probe to sequences that are not 100% the same.
Concentration of the denaturant in the buffer
For example: Deionized Formamide and SDS can be used to reduce non-specific binding of the probe
Length and nature of the probe sequence
STRINGENCY AND BINDING
– Long Probe
– Probe has increased number of G and C bases
Binding occurs under more stringent conditions
– Short Probe
– Probe has increased number of A and T bases
Binding occurs under less stringent conditions
Melting Temperature (Tm) Long Probes
The ideal hybridization conditions are estimated from the calculation of the Tm.
The Tm of the probe sequence is a way to express the amount of energy required to separate the hybridized strands of a given sequence.
At the Tm: Half of the sequence is double stranded and half of the sequence is single stranded.
If we keep in mind that RNA is single stranded (ss) and DNA is double stranded (ds), then the following must be true:
RNA : DNA Hybrids More stable
DNA : RNA Hybrids ↓
DNA : DNA Hybrids Less stable
Tm of RNA probes is higher, therefore RNA : DNA hybrids increase the Tm by 20 – 25°C
Calculating the Tm for Short Probes (14 – 20 base pairs)
Tm = 4°C x number of G/C pairs + 2°C x number of A/T pairs
The hybridization temperature (annealing temp) of oligonucleotide probes is approximately 5°C below the melting temperature.
Sequence Complexity (Cot)
Sequence complexity refers to the length of unique, non-repetitive nucleotide sequences.
Cot = Initial DNA Concentration (Co) x time required to reanneal it (t)
Cot1/2 = Time required for half of the double-stranded sequence to anneal under a given set of conditions.
Short probes can hybridize in 1 – 2 hours, where long probes require more time.
Test Your Knowledge
Calculate the melting temperature of the DNA sequence below:
ATCTGCGAAATCAGTCCCGG
TAGACGCTTTAGTCAGGGCC
Answer
If the number of G/C pairs = 11, and the number of A/T pairs = 9. The calculation is as follows:
4(11) + 2(9) = X
X = 62°C
-LeAnne Noll, BS, MB(ASCP)CM is a molecular technologist in Wisconsin and was recognized as one of ASCP’s Top Five from the 40 Under Forty Program in 2015.
“Blotting,” in relation to molecular diagnostics, is a term that refers to the process of detecting the presence and quantity of DNA, RNA, or protein in cells. There are three main types of blotting procedures that those in the field should be familiar with: Southern, Northern, and Western. Three additional blotting procedures are termed Southwestern, Eastern, and Far-Eastern. These are also summarized in the table below.
Depurination – Gel is soaked in hydrogen chloride (HCl) to remove the purine bases from the sugar-phosphate backbone. This loosens up larger fragments before denaturation.
Denaturation – The DNA is denatured by exposing the gel to sodium hydroxide (NaOH). Denaturation breaks the hydrogen bonds that hold the DNA strands together.
Blotting – The denatured DNA is transferred to a solid substrate (nitrocellulose) that helps to facilitate probe binding and signal detection.
Pre-hybridization – Prevents non-specific binding of the probe to other sites on the membrane surface.
The membrane is exposed to the hybridization probe, usually a single DNA fragment with a specific sequence to the target DNA. The probe DNA is labelled either with radioactivity or fluorescent dyes.
Importance of the Membrane
Nitrocellulose and nylon membranes are best for smaller sized single stranded DNA fragments. It is compatible with many types of buffers and transfer systems. These membranes work well with protein and nucleic acids.
METHODS OF TRANSFER
Capillary Transfer
Utilizes capillary movement of the buffer from a soaked paper to the dry paper
Denatured DNA moves from the gel to the membrane
Electrophoretic Transfer
Electric current moves the DNA from the gel to the membrane
Vacuum Transfer
The force from suction moves the DNA from the gel to the membrane
Northern Blots
Northern blots are used in the laboratory to look at RNA structure and quantity. It’s a powerful method that can measure levels of gene expression, as well as structural abnormalities in RNA.
Needs to take place in an RNase-free environment.
The samples are applied directly to an agarose gel.
The sample is cut out from the gel, soaked in ammonium acetate to remove the denaturant (denaturant is inhibitory to the binding of RNA to nitrocellulose membranes), and stained with acridine orange or ethidium bromide.
Western Blots
Western blots detect proteins and separates them according to their molecular weight or charge
Run using a polyacrylamide gel with molecular weight standards / markers.
Utilizes capillary or electrophoretic transfer methods.
Membrane must be blocked with a solution to prevent binding of the primary antibody probe to the membrane.
TYPES OF PROBES
DNA Probes
Southern Blots
Complementary to the target gene
RNA Probes
Northern Blots
Complementary to the target sequence
Protein Probes
Western Blots
Antibodies bind to the target protein
SUMMARY OF HYBRIDIZATION TECHNIQUES
Method
Target
Probe
Purpose
Southern Blot
DNA
Nucleic Acid
· Gene structure
Northern Blot
RNA
Nucleic Acid
· RNA transcript structure, processing, and gene expression
Western Blot
Protein
Protein
· Protein processing and gene expression
Southwestern Blot
Protein
DNA
· DNA binding proteins and gene regulation
Eastern Blot
Protein
Protein
· Modification to western blot using enzymatic detection
· Detection of specific agriculturally important proteins
Far-Eastern Blot
Lipids
None
· Transfer of HPLC-separated lipids to PVDF membranes for analysis by mass spectrometry
-LeAnne Noll, BS, MB(ASCP)CM is a molecular technologist in Wisconsin and was recognized as one of ASCP’s Top Five from the 40 Under Forty Program in 2015.
Analysis of a DNA sequence can be accomplished via a method called electrophoresis. Electrophoresis is a term that basically describes the movement of molecules by way of an electric current and separation of those molecules based on size. This process occurs through agarose or polyacrylamide gels, which serve as a way to limit migration of molecules as they move from the negative anode to positive anode. Small molecules move through the gel matrix faster than larger molecules.
How does it work?
Each phosphate group from a DNA molecule is ionized
↓
DNA becomes negatively charged
↓
DNA migrates towards the positive pole (anode)
Factors Affecting Electrophoretic Separation
Strength of the electric current (voltage)
Concentration and type of the buffer
Gel density
Size of the DNA
AGAROSE CONCENTRATION AND SEPARATION RANGES
Agarose Concentration (%)
Separation Range (base pair size)
0.3
5,000 – 60,000
0.6
1,000 – 20,000
0.8
800 – 10,000
1.0
400 – 8,000
1.2
300 – 7,000
1.5
200 – 4,000
2.0
100 – 3,000
As agarose concentration increases, the separation range decreases
TYPES OF ELECTROPHORESIS SYSTEMS
Pulsed Field Electrophoresis
Best for very large DNA molecules
Current is applied in alternating directions
Field Inversion Gel Electrophoresis
(FIGE)
Alternates the + and – electrodes
Requires temperature controls and a switching mechanism
Polyacrylamide Gel Electrophoresis
(PAGE)
Best for very small DNA fragments
Initially used for protein separation, but can also be used for high resolution of nucleic acids
Capillary Electrophoresis
Molecules are separated by size and charge
Small Molecules = Fast
Large Molecules = Slow
Negatively Charged = Fast
Positively Charged = Slow
Utilizes a polymer inside of a capillary instead of a gel
Increased sensitivity
Understanding Buffer Systems
In order to change the pH of a buffered solution by one point, either the acidic or basic form of the buffer must be brought to a concentration 1/10th that of the other form.
Test Your Knowledge
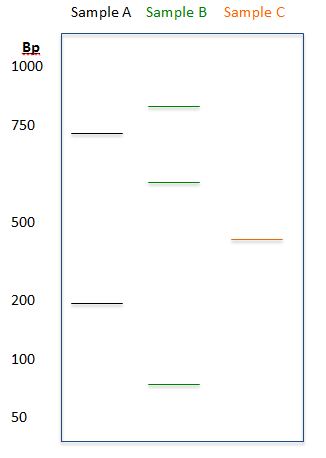
Based on the diagram, determine the sizes (to the best approximation) of the DNA fragments for each of the samples:
Answer:
Sample A: 200bp, 700bp
Sample B: 90bp, 600bp, 875bp
Sample C: 400bp
-LeAnne Noll, BS, MB(ASCP)CM is a molecular technologist in Wisconsin and was recognized as one of ASCP’s Top Five from the 40 Under Forty Program in 2015.
If you’re involved with molecular diagnostics, then L. J. Lee’s team at the Ohio State University would like your input. They’ve developed a new technology using molecular beacons and would love for lab directors, managers, and bench technologists to answer this short survey.
When considering methods to extract nucleic acids (DNA and RNA) to be used in downstream applications, it is important to think about what the sample source will be, as well as if it will be able to be used in an eventual assay. Being able to extract and purify DNA can lead to important information on infectious disease testing as well as patient genotype analysis. Purification of RNA can aid in understanding gene expression. However, once nucleic acid is extracted from a specimen, an additional set of parameters and guidelines are put in place to ensure that quality standards are met and the nucleic acid has not been compromised, ultimately leading to its ability to be used in patient testing.
Specimens / Sample Sources
Fresh Tissue in the form of cells such as, buccal cells, swabbed cervical cells, and even fresh DNA from the root of a single hair are all easily collected, stored, and provide enough DNA to be used in downstream PCR assays.
Whole Blood samples are easily available and require relatively simple methods to extract nucleic acid. However, the main source of issues comes from the type of anticoagulant that the blood specimen is mixed with. EDTA, Heparin, and ACD are all available as coating in blood collection tubes and are used to prevent clotting of the sample. Studies have shown that EDTA and ACD are acceptable anticoagulants that minimally interfere the quality and quantity of extracted nucleic acid as well as downstream PCR applications. Conversely, heparin is not completely removed during extraction procedures and can have an inhibitory effect on PCR and other enzyme based assays. Methods to eliminate heparin from a sample can be employed and include ethanol precipitation, boiling, and filtering.
Formalin-Fixed, Paraffin-Embedded Tissues provide a wealth of samples as these types of preserved tissues are typically stored in great numbers by pathology departments. The problem with tissues preserved in this manner is that quality is definitely compromised. When nucleic acids are exposed to fixatives, such as formalin, they become seriously fragmented and degraded. While these sources of samples aren’t ideal, there still are many benefits to using formalin-fixed or paraffin-embedded samples.
Extraction Methods
While most high volume laboratories employ automated extraction methods carried out on large pieces of instrumentation, there are laboratories that perform manual extractions at the bench. Manual extraction provides some of the best quality of nucleic acid samples. Typically, the purity of the nucleic acid is slightly compromised when automated methodology is employed; however the effect is somewhat negligible and allows a high volume of samples to be processed in various downstream applications.
Regardless of the sample type, the first steps of any extraction involve tissue isolation, disruption, and lysis of the cells. Paraffin-embedded samples require an initial step to remove the paraffin from the sample and this is accomplished via heat or the use of xylene. When isolating nucleic acids from blood, the white blood cells are isolated prior to extraction. Molecular detergents, such as SDS (Sodium Dodecyl Sulfate) are utilized to lyse the cells. Sometimes laboratories include a Proteinase K step due to the high amount of protein present in cell lysates.
Extraction methods vary, but the most common fall into three typical groups: Organic, Inorganic, or Solid Phase. Organic extractions utilize organic chemicals such as phenol or chloroform. Inorganic extractions use inorganic chemicals such as detergents, EDTA, acetic acid, or salt. Solid phase extractions immobilize nucleic acid on solid support system such as a spin columns or beads. Many automated extraction instruments employ silica bead based extraction chemistry.
Quality Assessment of DNA (Measurements)
Many PCR assays require a quality check for the nucleic acid purity and/or concentration. Spectrophotometers are an easy way to assess these two quality measures. Nucleic acids exhibit maximum absorption at 260nm and proteins at 280nm. Therefore, purity of a sample is assessed by measuring the optical density (OD) at 260nm and 280nm and calculating the ratio: OD260/280. A nucleic acid purity ratio of 1.8 – 2.0 is considered relatively pure. A reading less than 1.8 suggests protein contamination and readings above 2.0 suggest increased presence of RNA.
Note: An OD260 of 1.0 corresponds to 50 μg/mL of double stranded DNA or 40 μg/mL of RNA
A simple formula is used to calculate the quantity (concentration) of nucleic acid:
A= εbc
Where: A = Absorbance
ε = molar absorptivity
DNA is 50 L/mol-cm and RNA is 40 L/mol-cm
b = Path length (cm)
c = Concentration (mg/L)
Storage of Nucleic Acid
DNA can safely be stored long term if stored in Tris-EDTA buffer at 4°C. Typically, the colder the temperature, the less chance for degradation. Ideally, store DNA at -80°C and reduce the amount of freeze-thaw cycles. RNA should be stored in the same type of buffer at -80°C.
Test your Knowledge!
The following DNA samples are extracted from a whole blood sample and assessed on a spectrophotometer. Calculate the purity of each sample and comment on its quality:
Sample
A260
A280
1
0.500
0.270
2
0.320
0.310
3
0.445
0.219
Calculate the concentration of DNA and RNA if the A260 reading = 0.225 at a 1:100 dilution and the spectrophotometer has a 1.0 cm pathlength.
Answers
1.
Sample 1 = 1.85. The purity is considered ideal for DNA
Sample 2 = 1.00 which suggests protein contamination
Sample 3 = 2.11 which is ok for RNA
2. Solving for concentration (“c” from the formula above)
DNA: 1125 μg/mL
RNA: 900 μg/mL
-LeAnne Noll, BS, MB(ASCP)CM is a molecular technologist at Children’s Hospital of Wisconsin and was recognized as one of ASCP’s Top Five from the 40 Under Forty Program in 2015.
One of the first things students of biology learn is basic molecular theory or, the central dogma of biology. The central dogma of biology states that “DNA makes RNA and RNA makes protein.” We know that the process of converting DNA to protein is not one involving magic, but rather more intricate methods termed, transcription and translation. For a quick review, check out my post A Primer on DNA and the Consequences of Mutation.
As we take a closer look at transcription, we will investigate how DNA is converted into pre-messenger RNA and ultimately into messenger RNA. The manner in which this occurs is termed RNA Splicing. Following splicing, mRNA is transported out of the nucleus to indirectly assist with protein synthesis.
In most eukaryotic genes, coding regions are interrupted by non-coding regions. Coding regions are termed exons, where alternatively non-coding regions are called introns. The coding region made up of exons is also called the open reading frame. During the process of transcription, DNA of an entire gene is translated into RNA, more specifically termed pre-messenger RNA (pre-mRNA). Pre-mRNA includes both exons and introns. Through a process, called RNA splicing, the introns of the gene are removed allowing the exons to be joined forming a continuous coding sequence. The continuous coding sequence is referred to as messenger RNA. mRNA contains a 5’ cap consisting of 7 methyl guanosine, a 3’ polyA tail, and is ready for translation into protein.
EXONS–Coding regions of the DNA that make up the mature messenger RNA
INTRONS–Non-coding regions that are removed from the DNA sequence to form mature messenger RNA
PROMOTER–Found at the 5′ end of the DNA sequence and functions to initiate transcription
Mature mRNA: 5′ 7 Me G–111122222222222222233333–AAAAA 3′
Test your Knowledge!
What is the function of the 5’ 7-methyl guanosine cap?
What enzyme is responsible for the addition of the polyA tail to the 3’ end of the mRNA?
What structures of the mRNA are translated into protein?
Answers
The 7-methyl guanosine cap is recognized as a site that signals the start of translation
Polyadenylate polymerase adds the multiple adenines to the 3’ end of an mRNA sequence
Introns are spliced out of the open reading frame and the exons are translated into protein
-LeAnne Noll, BS, MB(ASCP)CM is a molecular technologist at Children’s Hospital of Wisconsin and was recognized as one of ASCP’s Top Five from the 40 Under Forty Program in 2015.
In a post back in September, I quickly summarized the abnormalities that can occur with chromosomes as a whole (such as deletions, insertions, transversions, etc). There is so much more to learn (more than I could possibly put into one blog post), because the way chromosomes behave, depends on their structure and DNA sequence. For instance, genes with the same DNA sequence will behave differently depending on where they are located on a chromosome as well as the effect of the surrounding DNA sequence.
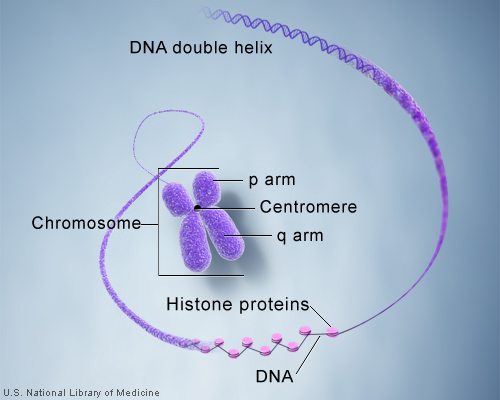
So how exactly is the immense length of DNA compacted into a chromosome? Let’s take a DNA sequence and see just how it makes up a chromosome. A single molecule of DNA spools around histone protein cores forming bead like structures called nucleosomes. Between each nucleosome is a sequence of DNA termed “linker DNA.” The amino acids associated with histones are lysine and arginine. The super coiled form is compacted and can be visualized as a karyotype in laboratory testing.
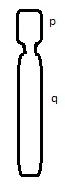
The centromere is the connection point of the duplicated chromosome, while telomeres are the endpoints. The short arm of the chromosome is termed “p” and the long arm of the chromosome is termed “q.” If we take these two chromosome arms into consideration, there are three types of chromosome morphology:
Metacentric – Chromosome arms are equal in length
Sub-centric – One arm is longer than the other
Acro-centric / Telocentric – One arm is extremely small or even missing
Chromosomal Staining Methods
As I mentioned above the complete set of chromosomes for an individual can be visualized via a karyotype. I’ve listed a few of the ways this can be accomplished:
G-Banding – Chromosomes are stained with giesma stains. The appearance differs based on the treatment of chromosomes prior to staining.
Q-Banding – Chromosomes are stained with fluorescent dyes, quinacrine or quinacrine mustard. Q-Band staining is similar to G-banding in that the fluorescent regions represent the AT-rich regions of the chromosome.
R-Banding – Results from heat treatment in a phosphate buffer followed by staining with Giesma dyes.
C-Banding – Centromere staining that results from alkali treatment.
TYPE OF BANDING
STAINING SUMMARY
G-Banding
· Geisma stain
· AT-rich regions stain darker than GC-rich regions
Q-Banding
· Quinacrine fluorescent dye stains AT-rich regions
R-Banding
· Banding pattern is opposite G-banding
C-Banding
· Stains heterochromatic regions close to the centromeres
· Usually stains the entire long arm of the Y chromosome
So how do you exactly identify chromosomal location based on banding patterns?
In studying disease and mutation, we follow a specific type of nomenclature to designate the regions that are of interest to us. Let’s take for instance something like the 22q11.2 deletion. What do all of these numbers and letters mean? To quickly summarize, 22q11.2 deletion syndrome occurs from the deletion of a small piece of chromosome 22 at a location: q11.2
22q11.2 DELETION
22
· Chromosome 22
q
· Long arm of chromosome (q)
1
· Region 1
1
· Band 1
2
· Sub band 2
So now, when we add in karyotope information you might see something like the following:
46, XY, del(8)(q21)
When you break it down, it states the patient is male (XY) and has a deletion in the long arm (q) of chromosome 8 at region 2, band 1
Translocation nomenclature can get a little more confusing:
46, XX, t(3;12)(p12.1;p11)
This designates a female has a translocation between the short arms (p) of chromosomes 3 and 12 and region 1, band 2, sub band 1; and region 1 band 1 respectively.
An example of Down syndrome: 47, XX + 21 (Female has an extra chromosome 21)
An example of Klinefelter Syndrome: 47, XXY (Male with extra X chromosome)
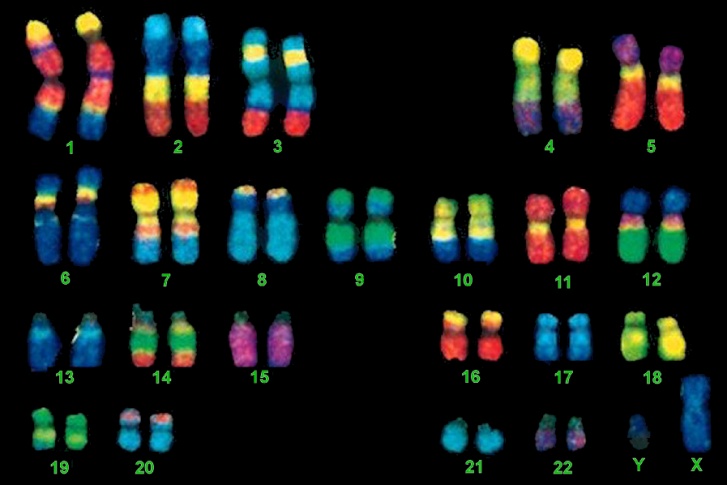
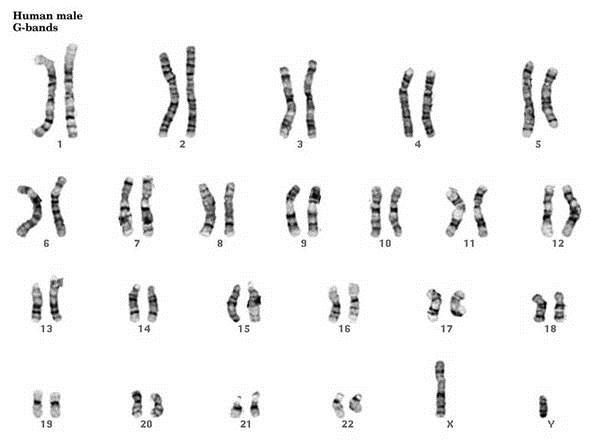
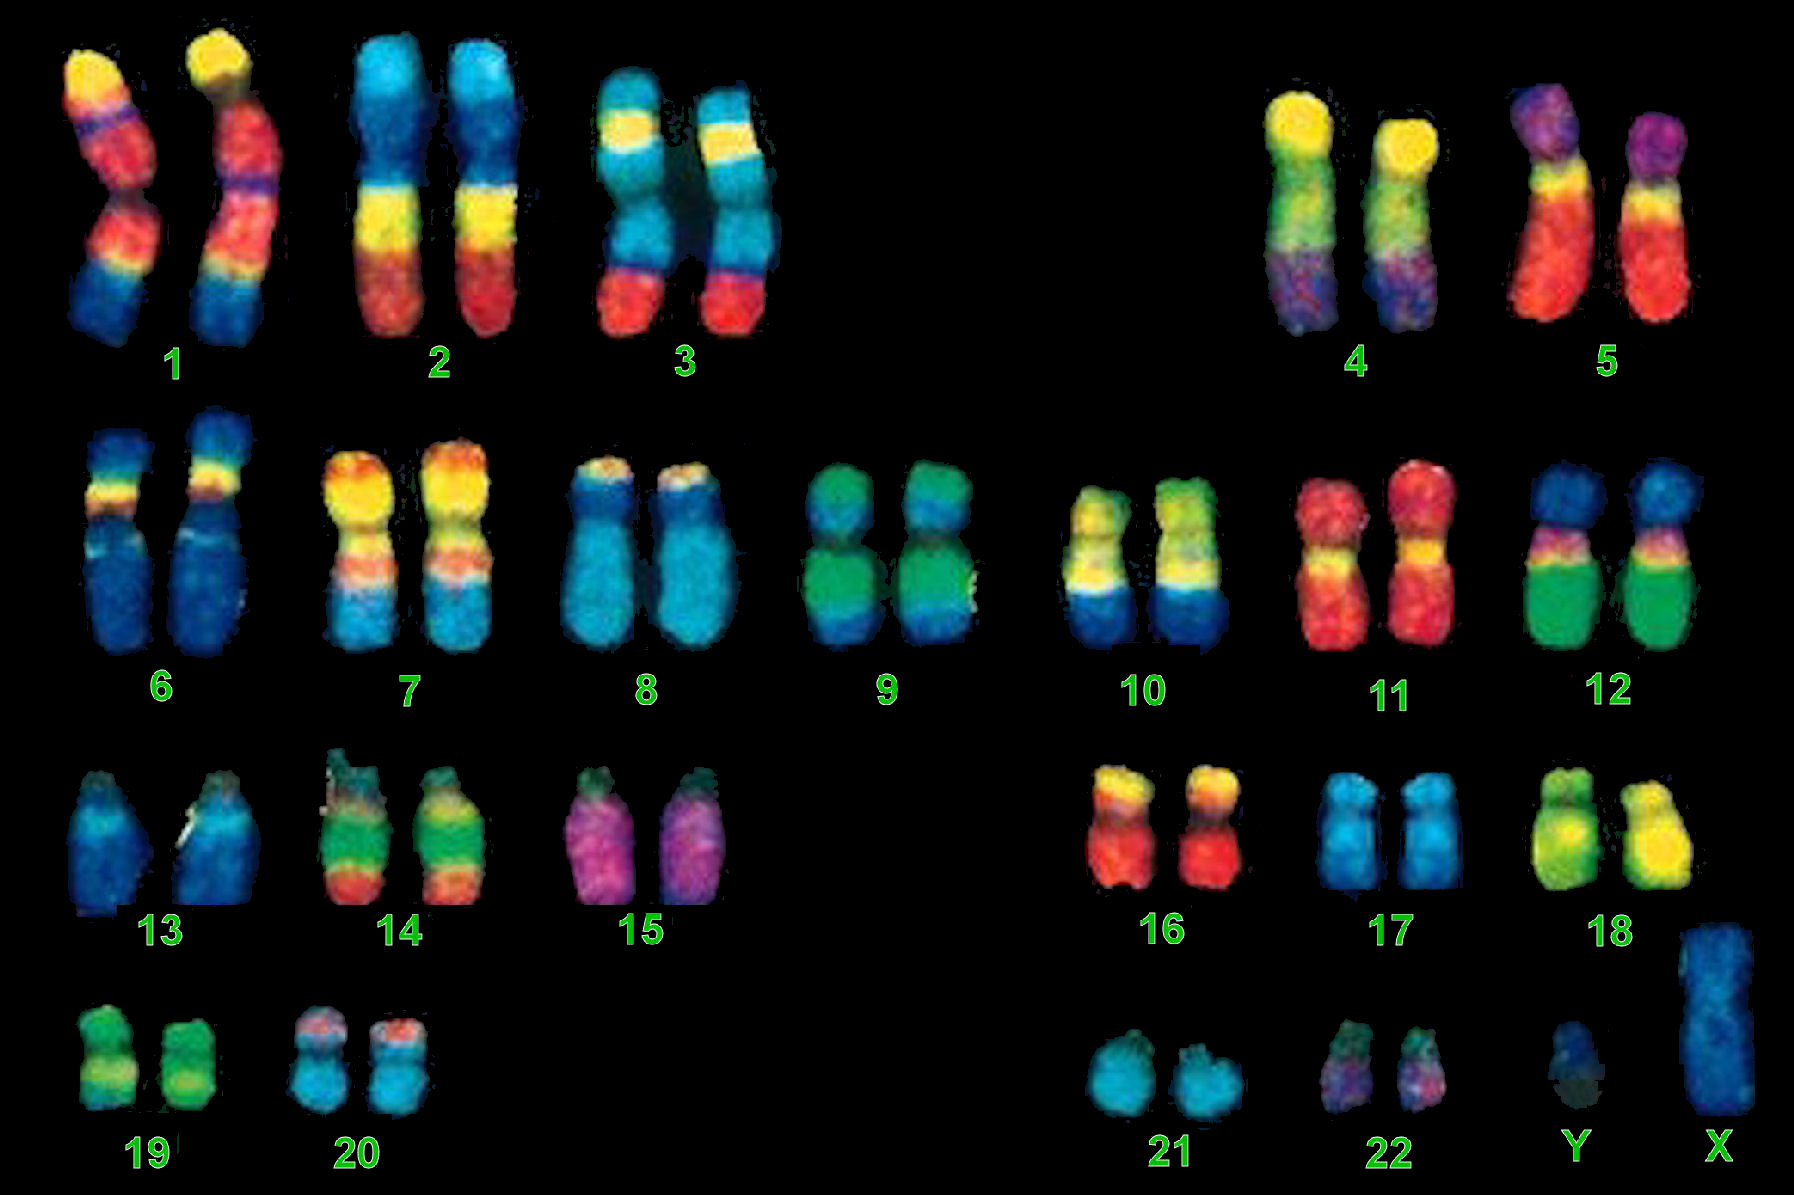
What do “FISH” have to do with Molecular Biology?
FISH, an acronym for Fluorescent In-Situ Hybridization, is a method used to detect and visualize protein, RNA, and DNA structures in the cell. FISH analysis is a relatively fast method that provides great resolution as it incorporates fluorescent probes labeled for detection of specific regions, deletions, and translocations. The images below show the difference between FISH and Karyotype images.
Robertsonian translocations are of importance because they involve translocating most of one entire chromosome to the centromere of another chromosome. They can be balanced or unbalanced. A balanced translocation usually results in no health difficulties because there isn’t a gain or loss of genetic material. However, due to the duplication or deletion of genetic material in an unbalanced translocation, syndromes and other malformations are likely to occur. The chromosome pairs common for Robertsonian translocations include translocations between 13 and 14, 14 and 21, and 14 and 15.
During a Robertsonian Translocation two chromosomes (typically acrocentric in formation) will break apart at their centromeres. The long arms will fuse to form a single chromosome and the short arms will also join to form a product. Typically the product created by the short arms contains nonessential genes and is eventually lost through cell division. Most people with ROB have only 45 chromosomes in each cell containing all of the essential genetic material and appear normal.
An example of a balanced Robertsonian Translocation would be when the long arms of chromosomes 14 and 21 fuse together. Phenotypically, the heterozygous carrier would appear normal because there are two copies of the major chromosome arms, resulting in two copies of the essential genes. However, children of the carrier could inherit an unbalanced translocation that causes Trisomy 21 (Down Syndrome).
Test your Knowledge!
Which two amino acids are associated with histones?
What type of chromosome morphology is shown:
If you wanted to stain chromosomes to see varying regions that were AT-rich, which type of stain would you use?
Describe the following karyotype results: 46, XX, t(1;14)(p21.3; p17.6)
Answers
Lysine and Arginine
Sub-centric
G-Banding (although Q-Banding also will produce darker regions that are AT-rich)
Female patient, with a translocation between the p and q arms of chromosomes 1 and 14, and region 2, band 1, sub band 3; and region 1 band 7, sub band 6 respectively.
References:
Buckingham, L. (2012). Molecular Diagnostics: Fundamentals, Methods and Clinical Applications (2nd ed.). Philadelphia: F.A. Davis Company.
Coleman, W.B, Tsonagalis, G.J. (2005). Molecular Diagnostics: For the Clinical Laboratorian. New York: Springer-Verlang
Searle, B. Rarechromo.org. The Rare Chromosome Disorder Support Group. 1996. Web. 19 Dec. 2015.
-LeAnne Noll, BS, MB(ASCP)CM is a molecular technologist at Children’s Hospital of Wisconsin and was recognized as one of ASCP’s Top Five from the 40 Under Forty Program in 2015.
To gain a solid understanding of Molecular Diagnostics, one has to grasp the fundamentals of DNA Replication. The double helix nature of DNA requires numerous moving parts working together to produce two identical strands of DNA from one original DNA molecule.
The semi-conservative process of DNA replication occurs in a 5’ to 3’ anti-parallel direction. The replication process is described as semi-conservative because the sequence of nucleotides is maintained through new generations of replication. An extremely important enzyme involved in the beginning stages of DNA replication, is called Topoisomerase. It is responsible for regulating the over-winding and under-winding of DNA just ahead of the replication fork. Topoisomerase binds to the DNA then “cuts” the phosphate backbone so that the DNA can be unwound then resealed at the end of replication. Also, before replication can begin, an enzyme called helicase must first unwind and untangle the double-stranded DNA. Single stranded binding proteins (ssbp) prevent premature binding as well as protect the single stranded DNA from being digested by nucleases.
Leading Strand vs. Lagging Strand
During replication, two separate strands of DNA are formed in different ways. The lagging strand exhibits discontinuous 3’ to 5’ growth away from the replication fork and requires primase to “prime” the synthesis of the lagging strand. An RNA primer is added to the lagging strand of the DNA by RNA polymerase. This RNA primer begins synthesis of the lagging strand. The separate fragments of the lagging strand are termed Okazaki fragments. It’s important to note that due to the discontinuous formation of the lagging strand, each Okazaki fragment requires its own, separate, RNA primer. Finally, DNA ligase forms phophodiester bonds between the existing DNA strands to join the Okazaki fragments together. Alternatively, the leading strand during replication grows towards the replication fork in a 5’ to 3’ direction. The leading strand only needs one single RNA primer to immediately begin replication and therefore does not require DNA ligase.
LEADING STRAND SYNTHESIS
REQUIREMENTS
Toward Replication Fork
Single RNA Primer
5’→ 3’
Continuous Growth
LAGGING STRAND SYNTHESIS
REQUIREMENTS
Away from Replication Fork
Primase
3’→ 5’
Multiple RNA Primers
Discontinuous Growth
DNA Ligase
Creation of Okazaki Fragments
DNA Polymerase III and its Role in Replication
While you should become familiar with the extensive list of DNA Polymerases (shown below), the core polymerase involved in DNA replication is DNA Polymerase III. It functions as a catalyst in the formation of the phosphodiester bonds between an incoming deoxyribose nucleotide triphosphate (dNTP) determined by hydrogen bonding to the template at the 3’ end of the primer.
PROKARYOTIC DNA POLYMERASES
FUNCTION
DNA Polymerase I
Recombination, Repair, Replication
DNA Polymerase II
Repair
DNA Polymerase III
Core Polymerase
Replication
DNA Polymerase IV and V
Bypass DNA Damage (Y-Family DNA Polymerases)
EUKARYOTIC DNA POLYMERASES
FUNCTION
Alpha (α)
RNA Primase
Lagging Strand
Replication (Initiation, Okazaki Fragment Priming)
Beta (β)
DNA Repair
Delta (δ)
Leading Strand
Repair
Epsilon (ε)
Sensor of DNA replication that coordinates transcription cycle
Repair
Gamma (γ)
Mitochondrial Replication
RNA POLYMERASES
FUNCTION
RNA Polymerase I
rRNA (ribosomal RNA)
RNA Polymerase II
mRNA (messenger RNA)
RNA Polymerase III
tRNA (transfer RNA)
sbRNA (small nuclear RNA)
-LeAnne Noll, BS, MB(ASCP)CM is a molecular technologist at Children’s Hospital of Wisconsin and was recognized as one of ASCP’s Top Five from the 40 Under Forty Program in 2015.
Recently, I came across a research article that suggests an elevated germ-line mutation rate in teenage fathers, thus leading to an unexpectedly high level of DNA mutations in the children born to teenage fathers.
Many studies have been conducted on the theory that male germ cells go through a higher number of cell divisions when compared to that of female germ cells, and that the higher number of paternal cell divisions leads to an increased DNA mutation rate. The paper suggests that the increased presence of DNA mutations in sperm cells of teenage boys could explain why their offspring might be at higher risk for a spectrum of disorders when compared to parents in their twenties.
-LeAnne Noll, BS, MB(ASCP)CM is a molecular technologist at Children’s Hospital of Wisconsin and was recognized as one of ASCP’s Top Five from the 40 Under Forty Program in 2015.


