Is It Possible to Have Coexistence of Hepatitis B Surface Antigen and Antibody?

Hepatitis B surface antigen (HBsAg) is the serologic hallmark of acute Hepatitis B virus (HBV) infection. It can be detected in serum using immunoassays a few weeks after HBV infection, and normally disappears after 4-6 months in recovered patients (1). Antibodies against HBsAg (anti-HBs) appears as a response from the host immune system, and these antibodies neutralize HBV infectivity and clear circulating HBsAg (2). Anti-HBs generally persist in life, indicating recovery and immunity from HBV infection.

Some of us may simply assume that the presence of anti-HBs should always associated with the loss of HBsAg. However, it is possible to see concurrent anti-HBs and HBsAg in patients. In fact, coexistence of HBsAg and anti-HBs is not rare, and has been reported in 10 to 25 percent of HBV chronic carriers in previous studies (3-4).  The underlying mechanism is not fully understood but several reports explained it as HBsAg mutants escaping the immune system (2-4). HBsAg mutants are believed to arise under the selective pressure from the host immune system, or from vaccinations (4-6).

“a” determinant in HBsAg is one of the main target of anti-HBs. It has been reported that mutations in the “a” determinant of the surface gene (S-gene) result in amino acid substitutions in HBsAg, and reduce the binding of anti-HBs to HBsAg, leading to immune escape (4). The first HBV mutant was reported by Zanetti et al in 1988 as G145R mutation. In their report, infants born to HBsAg carrier mothers developed breakthrough infections despite receiving HBIG and HBV vaccine at birth (5). Since this report, several other HBsAg mutations have been reported (4, 6).

Currently, there is no easily available assay to diagnose individuals who are suspected of harboring HBsAg escape mutants. Moreover, mutated HBsAg may leads to false negativity in some serologic assays, leading to a missed diagnosis of chronic HBV infection (6). Another concern is the potential risk of transmission to others, as vaccination does not provide protection from these mutated viruses (8); this is especially important in liver transplant recipient and newborns from HBsAg positive mothers.

References

  1. Lok A, Esteban R, Mitty J. Hepatitis B virus: Screening and diagnosis. UpToDate. Retrieved Feb 2018 from https://www.uptodate.com/contents/hepatitis-b-virus-screening-and-diagnosis#H3
  2. Liu W, Hu T, Wang X, Chen Y, Huang M, Yuan C, Guan M. Coexistence of hepatitis B surface antigen and anti-HBs in Chinese chronic hepatitis B virus patients relating to genotype C and mutations in the S and P gene reverse transcriptase region. Arch Virol 2012;157:627–34.
  3. Colson P, Borentain P, Motte A, Henry M, Moal V, Botta-Fridlund D, Tamalet C, Gérolami R. Clinical and virological significance of the co-existence of HBsAg and anti-HBs antibodies in hepatitis B chronic carriers. Virology 2007;367:30–40.
  4. Lada O, Benhamou Y, Poynard T, Thibault V. Coexistence of hepatitis B surface antigen (HBs Ag) and anti-HBs antibodies in chronic hepatitis B virus carriers: influence of “a” determinant variants. J Virol. 2006 Mar;80(6):2968-75.
  5. Zanetti AR, Tanzi E, Manzillo G, Maio G, Sbreglia C, Caporaso N, Thomas H, Zuckerman AJ. Hepatitis B variant in Europe. 1988 Nov 12; 2(8620):1132-3.
  6. Leong J, Lin D, Nguyen M. Hepatitis B surface antigen escape mutations: Indications for initiation of antiviral therapy revisited. World J Clin Cases 2016;4:71.
  7. Colson P, Borentain P, Motte A, Henry M, Moal V, Botta-Fridlund D, Tamalet C, Gérolami R. Clinical and virological significance of the co-existence of HBsAg and anti-HBs antibodies in hepatitis B chronic carriers. 2007;367:30–40.
  8. Thakur V, Kazim S, Guptan R, Hasnain S, Bartholomeusz A, Malhotra V, Sarin S. Transmission of G145R mutant of HBV to an unrelated contact. J Med Virol 2005;76:40–6.


Xin-small

-Xin Yi, PhD, DABCC, FACB, is a board-certified clinical chemist, currently serving as the Co-director of Clinical Chemistry at Houston Methodist Hospital in Houston, TX and an Assistant Professor of Clinical Pathology and Laboratory Medicine at Weill Cornell Medical College.

A Laboratory Professional’s Perspective on the Opioid Crisis

It was in the 1980s that physicians first explored the use of narcotics/opioids for the treatment of pain associated with non-terminal illnesses, including chronic and “mild to moderate” pain. In 2012, opioid prescriptions for outpatients were common, and some states had as many as 143 opioid prescriptions for every 100 people. Today, more than 6 out of 10 drug overdoses involve an opioid. The CDC states that 91 Americans die every day from an opioid overdose. This situation has been called “the opioid crisis” and the “opioid epidemic.” It is a public health emergency.

The landscape is characterized by new trends in both the drugs involved and drug user demographics. Current data indicates that prescription opioids are not the main problem. In fact, from 2015 to 2016, prescription opioid overdoses decreased from 17,539 to 16,800. The decrease in prescription overdose may indicate that efforts to reduce over-prescribing may be working. Or, drug users may be abandoning high cost prescription opioids for illicit drugs.

While prescription opioid overdoses have been decreasing, the incidence of heroin overdose has tripled. The incidence of fentanyl overdose has increased 196%, and the incidence of overdose due to non-methadone synthetic opioids has increased by 72%. Fentanyl is available both legally by prescription, and illegally from illicit sources. It is frequently combined with or sold as other drugs such as heroin, cocaine, and alprazolam. Fentanyl is 100 times more potent than morphine, and 50-100 times more potent than heroin. Even more dangerous are the fentanyl analogs, carfetanil(yl) sufentanil, acry and acetyl fentanyl, and furanyl fentanyl, to name a few. Sufentanil is 1000 times more potent than morphine, and carfentanil – sometimes called elephant tranquilizer – is 10,000 times more potent than morphine. Opioid abuse now spans nearly all demographics. In fact, NCHS Data Brief in 2017 disclosed that the age group with the most rapid rise in opioid overdose is adults ages 55-64 years. Some of the greatest increases in heroin related deaths have been among women, privately insured, and those with higher incomes – demographic groups that historically have had low rates of heroin abuse.

Laboratory professionals can help fight this crisis by providing relevant testing, and billing for the testing appropriately. Most hospitals are ill equipped to test for the synthetic opioid analogs. For many hospitals, the drug testing capabilities consists of an immunoassay based urine drug screen. These screens can detect many of the “classic” drugs of abuse like morphine (heroin), cocaine, amphetamines, PCP, and benzodiazepines. These screens do not differentiate individual drugs in a drug class, and they can’t detect fentanyl or fentanyl analogs, even with high degrees of cross-reactivity. As our Vice President of Laboratories expressed it to me, “our emergency rooms are full of overdose patients with negative drug screens.” Unfortunately, the culprit drug is not identified until a medical examiner orders forensic toxicology. More comprehensive and confirmatory testing like mass-spectrometry based testing provides more accurate information.

Mass spectrometers are not cheap, and many laboratory professionals are challenged with obtaining funding for them. The challenge is not lessened by the bad taste left in Medicaid’s mouth by code-stacking when billing for drug testing in the pain management patient population. This practice was, unfortunately, exploited by some physicians running office-based drug testing labs. Large multi-drug LCMS based panels were used in routine monitoring of pain management testing but instead of billing per panel, the test was billed by drug (analyte) in the panel. This practice led to CMS scrutinizing the use of mass spec testing alone and recommending the limited immunoassays. Laboratory professionals have the responsibility to advocate for the appropriate use of this powerful testing, and fortunately we are doing that – the Academy of AACC in collaboration with American Academy of Pain Medicine just released guidelines for the use of laboratory tests in monitoring pain management patients. We need to be trusted to do the right test, at the right time, for the right patient.

Forensic pathologists and toxicologists also face big challenges related to the opioid crisis. Forensic toxicologists are challenged to keep up analytically with synthetic and novel drugs entering the market while dealing with the pressure of limited budgets and client frustration with long turnaround times. Forensic pathologists are challenged by the sheer volume of overdose-related deaths. The National Academy of Medical Examiners (NAME) limits the number of autopsies to 325/pathologist/year. There are currently only around 500 board certified forensic pathologists in the US and the future doesn’t look great – only 3% of graduating medical students choose to enter pathology and only 7% of those will enter forensic pathology.


Sarah Brown Headshot_small

Sarah Riley, PhD, DABCC, is an Assistant Professor of Pediatrics and Pathology and Immunology at Washington University in St. Louis School of Medicine. She is passionate about bringing the lab out of the basement and into the forefront of global health.  

Which Potassium Do You Believe?

A patient presented to the Emergency Department at the St. Paul’s Hospital. Initial blood was collected by phlebotomy staff (one poke) at 6:55 am in the morning and the specimen was received in the lab at 7:11 am.

Venous blood gases: Potassium  7.3 mmol/L
Plasma Lytes: Potassium  3.3 mmol/L

Emergency phoned the lab about these discrepant potassium results. What is going on?! The venous gas specimen was centrifuged and appeared hemolysed (3+), while the plasma sample had no evidence of hemolysis.

The phlebotomist indicated there was no problem with the collection. Repeat testing was initiated an hour later.

Venous blood gases: Potassium  6.4 mmol/L
Plasma Lytes: Potassium  3.6 mmol/L

The venous gas specimen was centrifuged and appeared hemolysed (3+).

Because the venous gas specimens were transported on ice and the other tubes of blood collected were sent at room temperature, the biochemist discussed the possibility of a red cell cold agglutinin with the ER physicians. The ER physicians requested evaluation for a cold agglutinin (the EDTA tube collected for early hematology was used for this analysis). Lab staff performed the screen and it was 4+ for cold agglutinin.  ER physicians were advised to believe the lower potassium results and to avoid sending further specimens on ice for this patient.


Lyon-small

-Dr. Andrew Lyon, PhD, FCACB, DABCC is a clinical chemist and clinical toxicologist. He is the current past-president of the Canadian Society of Clinical Chemists. He is currently Division Head of Clinical Biochemistry of the Saskatoon Health Region and teaches general pathology residents as a clinical associate professor of Pathology and Laboratory Medicine at the University of Saskatchewan.

Pitfalls of Prolactin Biochemistry Assay

Laboratories occasionally get questions from clinicians about prolactin results, mainly to either rule out high-dose hook effect or assess interference from macroprolactin. In most laboratories, sandwich immunoassay is used to measure prolactin concentration and it is widely known that older generations of prolactin assays suffer from hook effect and interference from macroprolactin. In the presence of extremely high concentration of prolactin, antibodies can be saturated, resulting in falsely low results, which is known as high-dose hook effect. Multiple cases have been reported in patients with giant prolactinomas, that their prolactin results were measured as normal or moderately elevated. In order to rule out high-dose hook effect, clinicians normally request laboratories to perform appropriate dilutions for prolactin in patients with large pituitary tumors. Newer generation of prolactin assays have better performance in this aspect, and most assays nowadays have no hook effect up to concentrations of 10,000 ng/mL, claimed by manufactures.

Another pitfall of prolactin assay is the interference from macroprolactin. Macroprolactin is a complex of prolactin bound to immunoglobulin, and thought to be biologically inactive. In the presence of elevated macroprolactin, patient is asymptomatic. However, macroprolactin can be picked up by prolactin immunoassays to some extent, and results in misdiagnosis as hyperprolactinemia. Reports showed that 15-20% of cases with hyperprolactinemia was due to elevated macroprolactin. Therefore, macroprolactinemia should be considered while evaluating hyperprolactinemia cases in the absence of symptoms or pituitary imaging evidence. Laboratories could easily perform dilution study to test if interference exists. To confirm the presence of macroprolactin, polyethylene glycol (PEG) 6000 can be used to precipitate macroprolactin followed by prolactin measurement in the supernatant. The presence of macroprolactin is suggested when the pull-down percentage is greater than 40-50%. This test is offered by many reference laboratories.

These two pitfalls of prolactin biochemistry assays should always be kept in mind by laboratorians, to provide better guidance to clinicians’ concern and workups on prolactin related cases.   


Xin-small

-Xin Yi, PhD, DABCC, FACB, is a board-certified clinical chemist, currently serving as the Co-director of Clinical Chemistry at Houston Methodist Hospital in Houston, TX and an Assistant Professor of Clinical Pathology and Laboratory Medicine at Weill Cornell Medical College.

Pathologist on Call: There Is No Perfect Lab Test for Smoking Assessment

Cigarette smoking can affect both innate and adaptive immunity, and introduces concerns when evaluating a patient’s eligibility for surgery. It has been shown to hinder time required for healing and long-term survival of patients. It can promote vascular complications, increase the rates of hepatocellular carcinoma and reduce lung function.1 For lung transplantation, one of the common requirements of eligibility is smoking abstinence for at least 6 months. Smoking post-surgery is associated with worse outcomes for the patients including complications and higher rates of mortality.2 Relapse to smoking post lung transplantation has been reported to range from 11% to 23% in various patient populations.3 As a result, clinical testing for cigarette smoking abstinence is an important part of initial workup and follow-up of transplant patients.

In some situations, the burden of lung allocation weighs heavily on a single clinical laboratory result that is perceived to definitively confirm or exclude active cigarette smoking. This subsequently factors into the decision by the physicians to deem the patient eligible to receive a lung transplant. The perception of nicotine testing as definitive proof of smoking is misleading and does not reflect the complexity of situations that can lead to a positive test result.

How can we assess smoking?

Ideally, many factors should weigh into the final smoking status determination including self-reporting (used historically), witnesses to behavior, odor, and past history including cessation attempts. Clinical laboratory testing is important and thought to be more reliable means for smoking assessment. It can involve testing for nicotine (originating from tobacco or nicotine replacement therapy, NRT) and its metabolites: cotinine, 3-hydroxycotinine (3-OH-cotinine), and nornicotine. Moreover, nicotine contains a number of alkaloids that are not usually present in nicotine-replacement therapies (NRTs) including anatabine and anabasine.4 Nicotine testing can involve a combination of metabolites such as cotinine as well as alkaloids like anabasine. Various sample types have been used including saliva, blood and urine.5 In addition, measurements of the exhaled carbon monoxide (CO) have been used to assess recent smoking status (within the last 8 hours).6

Clinical case: patient with detectable nicotine metabolites

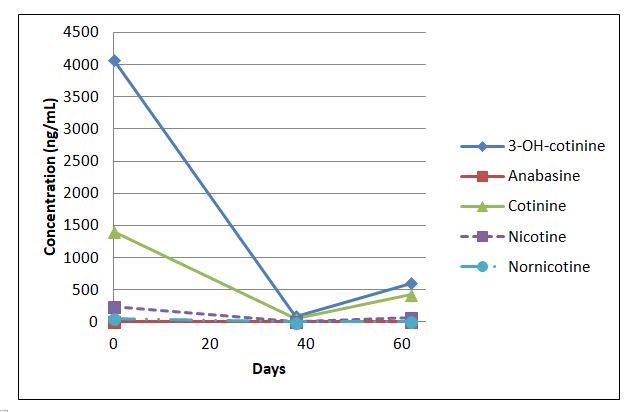
A case involving a patient being considered for lung transplantation was received by our department. The patient had been tested for anabasine, nicotine, and its metabolites in urine. Testing of random urine specimens was performed by liquid chromatography tandem mass spectrometry (LC-MS/MS) at different time points from samples collected during hospital visits (days 0, 38, and 62). The urine contained variable concentrations of nicotine and its metabolites, with anabasine concentrations below the detection limit in 2 out of the 3 testing instances. Testing at day 0 showed an interfering substance that prevented the determination of accurate anabasine concentration. The nicotine and its metabolite concentrations in the random urine specimens were lower from day 0 to day 38, but a noticeable increase of 3-OH-cotinine and cotinine concentrations was observed in the specimen collected on day 62. The physician was seeking information about the current smoking status of the patient and was planning to use this information to determine the patient’s lung transplant eligibility.

smoking-1


Days 0 38 62
Analyte concentration (ng/mL)
3-OH-cotinine 4074 89 603
Anabasine interf. subst. < 3 < 3
Cotinine 1404 47 425
Nicotine 241 < 2 72
Nornicotine 58 < 2 6


Figure and table 1. Nicotine, metabolite and anabasine concentrations (ng/mL) at different time points for a patient evaluated for lung transplantation eligibility. Anabasine was not detected on days 38 and 62, with an interfering substance preventing quantitation on day 0.

How definitive are these results?

No information was available regarding self-reported smoking or NRT use history for this patient. The physician had high suspicion that the patient was an active smoker and was attempting to use higher concentrations of nicotine and metabolites observed on day 62 as evidence of recent tobacco use.

For cotinine, values can range from 20-550 ng/mL for daily tobacco use.5 Nicotine concentrations in urine can approach over 5000 ng/mL with daily use. Together, high nicotine and cotinine can support tobacco or high-dose nicotine patch use. Furthermore, presence of nornicotine above 30 ng/mL along with anabasine greater than 10 ng/mL would be consistent with current tobacco use rather than NRT.7

Given that these were random urine specimen and the urinary creatinine values are not routinely measured, it’s important to consider the possible contributions of the variable urine concentration to the analyte concentrations. It has previously been reported that individuals abstaining from smoking for at least two weeks should present with nicotine of <30 ng/mL, cotinine of < 23 ng/mL, 3-OH-cotinine of <120 ng/mL, nornicotine < 3 ng/mL, and anabasine of < 2 ng/mL in urine.7 Based on these cut-offs, all analytes except anabasine would suggest new nicotine intake within the last two weeks.

In general, a positive anabasine result, in combination with the presence of nicotine metabolites, is consistent with active use of a tobacco product, whereas anabasine values of < 2ng/mL may suggest that NRT is the likely source.8 This can imply that the patient is abstinent from smoked or chewed tobacco if anabasine is not detected. However, anabasine is not a sensitive marker of smoked tobacco. It has been reported that the compound may not be detectable in 60% of self-reported smokers (N=51; 3 ng/mL cut-off in urine)9  and its urinary concentrations do not correlate well with self-reported tobacco use.8

As a result, anabasine has low sensitivity for determining eligibility for UNOS (United network for organ sharing) listing. There are some recommendations that this marker should not be used alone. Given that other alkaloids can originate from tobacco plant, it has been proposed that anatabine should be added to analysis due to higher expected concentration.9 However, this alkaloid is not completely specific to tobacco as it has been proposed to also arise from other plant sources 10,11  leading to possible implications for the patient that may be misclassified. In addition, anatabine sensitivity in detecting smoked tobacco use varies depending on the tobacco source and the clinical cut-off used. Clinical tests that include anatabine are not routinely available.

Can we improve this process?

Unfortunately, there is no definitive marker distinguishing smoking from NRT.

The determination of smoking status has advanced from reliance on self-reporting to quantitative and specific measurements of metabolites of nicotine and minor components of tobacco. Additional analyte incorporation into a test panel leads to additional complexities and considerations in interpretation of the results. Therefore, it is important to educate the physicians about various nicotine sources causing a positive nicotine and/or metabolite test result including NRT or e-cigarettes. It is also important to convey the limitations of tobacco alkaloid testing in such scenarios. Both the lab and the physician need to be cautious about implying active smoking in the absence of indirect supporting evidence and/or positive clinical test results.

At the same time, there is a need to improve the utility and availability of other tobacco alkaloid testing in distinguishing cigarette smoking from NRT in specific transplant populations and consider the value of testing alternative specimens. This may lead to a more effective implementation of secondary markers of tobacco use.

References

  1. Qiu, F.; Fan, P.; Nie, G. D.; Liu, H.; Liang, C.-L.; Yu, W.; Dai, Z., Effects of Cigarette Smoking on Transplant Survival: Extending or Shortening It? Frontiers in Immunology 2017, 8, 127.
  2. Zmeskal, M.; Kralikova, E.; Kurcova, I.; Pafko, P.; Lischke, R.; Fila, L.; Valentova Bartakova, L.; Fraser, K., Continued Smoking in Lung Transplant Patients: A Cross Sectional Survey. Zdravstveno varstvo 2016, 55 (1), 29-35.
  3. Vos, R.; De Vusser, K.; Schaevers, V.; Schoonis, A.; Lemaigre, V.; Dobbels, F.; Desmet, K.; Vanaudenaerde, B. M.; Van Raemdonck, D. E.; Dupont, L. J.; Verleden, G. M., Smoking resumption after lung transplantation: a sobering truth. The European respiratory journal 2010, 35 (6), 1411-3.
  4. Hukkanen, J.; Jacob, P., 3rd; Benowitz, N. L., Metabolism and disposition kinetics of nicotine. Pharmacological reviews 2005, 57 (1), 79-115.
  5. Raja, M.; Garg, A.; Yadav, P.; Jha, K.; Handa, S., Diagnostic Methods for Detection of Cotinine Level in Tobacco Users: A Review. Journal of clinical and diagnostic research : JCDR 2016, 10 (3), Ze04-6.
  6. Sandberg, A.; Skold, C. M.; Grunewald, J.; Eklund, A.; Wheelock, A. M., Assessing recent smoking status by measuring exhaled carbon monoxide levels. PloS one 2011, 6 (12), e28864.
  7. Moyer, T. P.; Charlson, J. R.; Enger, R. J.; Dale, L. C.; Ebbert, J. O.; Schroeder, D. R.; Hurt, R. D., Simultaneous analysis of nicotine, nicotine metabolites, and tobacco alkaloids in serum or urine by tandem mass spectrometry, with clinically relevant metabolic profiles. Clinical chemistry 2002, 48 (9), 1460-71.
  8. Jacob, P., 3rd; Hatsukami, D.; Severson, H.; Hall, S.; Yu, L.; Benowitz, N. L., Anabasine and anatabine as biomarkers for tobacco use during nicotine replacement therapy. Cancer epidemiology, biomarkers & prevention : a publication of the American Association for Cancer Research, cosponsored by the American Society of Preventive Oncology 2002, 11 (12), 1668-73.
  9. Feldhammer, M.; Ritchie, J. C., Anabasine Is a Poor Marker for Determining Smoking Status of Transplant Patients. Clinical chemistry 2017, 63 (2), 604-606.
  10. Lanier, R. K.; Gibson, K. D.; Cohen, A. E.; Varga, M., Effects of dietary supplementation with the solanaceae plant alkaloid anatabine on joint pain and stiffness: results from an internet-based survey study. Clinical medicine insights. Arthritis and musculoskeletal disorders 2013, 6, 73-84.
  11. von Weymarn, L. B.; Thomson, N. M.; Donny, E. C.; Hatsukami, D. K.; Murphy, S. E., Quantitation of the minor tobacco alkaloids nornicotine, anatabine, and anabasine in smokers’ urine by high throughput liquid chromatography mass spectrometry. Chemical research in toxicology 2016, 29 (3), 390-397.


VG

-Dr. Valentinas Gruzdys developed interest in clinical chemistry early in his academic training which led him to pursue and obtain a PhD in Clinical and Bioanalytical Chemistry at Cleveland State University. Valentinas is enthusiastic about teaching and helping improve the understanding of limitations and utility of clinical laboratory testing. He is currently enrolled in a clinical chemistry fellowship program at the University of Utah. He enjoys learning more about various aspects of clinical chemistry and cannot wait to make his own contributions to the field after his training.

Pseudohyperkalemia in Patients with Severe Leukocytosis

It has been reported many times that falsely elevated potassium can be seen in patients with severe leukocytosis from chronic lymphocytic leukemia (CLL). Early recognition of factitious hyperkalemia is very important to prevent inappropriate and potentially hazardous treatment. One case we observed in our institution, again, emphasized the importance and urgency to recognize these instances.

In this case, patient was a 58 year old male with recently diagnosed CLL. His potassium level rose from normal levels at admission to 8.9 mmol/L on repeated blood draws. Patient was asymptomatic with good strength on physical exam, and had no abnormalities on EKG or telemetry. Insulin/glucose and calcium gluconate was administered to correct potassium level and to prevent cardiac effect of hyperkalemia. The hyperkalemia result was initially thought to be due to emerging tumor lysis syndrome and was not brought to our attention until another specimen obtained had a potassium level greater than the measurable range (10.0 mmol/L). Specimens were not hemolyzed and white blood cell count was as high as 455K/µL.

Given his history of CLL, we suspected pseudohyperkalemia, an entity that has been attributed to the combination of the fragility of the leukemic lymphocytes and the mechanical stress on the cells during specimen transportation and centrifugation. Our clinical team was notified immediately, and a whole blood specimen was collected and hand carried to the laboratory. Without centrifuging, the whole blood specimen was analyzed on a blood gas analyzer and showed a potassium level of 4.2 mmol/L!!! Potassium-lowering treatment was discontinued.

Artifactually elevated potassium level is commonly seen due to red blood cell hemolysis, but not well appreciated is its occasional occurrence in patients with extreme leukocytosis from CLL. It is important for laboratorians to recognize this pattern and to notify our clinical teams so that patients are not inappropriately treated.


Xin-small

-Xin Yi, PhD, DABCC, FACB, is a board-certified clinical chemist, currently serving as the Co-director of Clinical Chemistry at Houston Methodist Hospital in Houston, TX and an Assistant Professor of Clinical Pathology and Laboratory Medicine at Weill Cornell Medical College.

Chemistry Case Study: Falsely Elevated Methotrexate

High dose methotrexate infusion is widely used in the treatment of malignancies such as leukemia, high risk lymphoma, and osteosarcoma. It can be associated with multiple adverse effects, especially renal toxicity, which could leads to acute kidney injury (AKI), delaying drug elimination and worsening its toxicity. Leucovorin, a reduce folic acid, is commonly used with methotrexate treatment to lessen its toxicity. After administration of methotrexate, serum creatinine and methotrexate concentration should be closely monitored. The levels of serum methotrexate to be associated with a high risk for nephrotoxicity are: 24 h, > 10 μmol/L; 48 h, > 1 μmol/L; 72 h, > 0.1 μmol/L.

In this case, the patient is a 33-yo old male with T-lymphoblastic leukemia in complete remission. He was given consolidation therapy with high dose methotrexate. Leucovorin rescue was given 24 hours after methotrexate administration. Patient’s methotrexate level was at 4.7 μmol/L 3 days postinfusion due to AKI and poor methotrexate clearance. An alternative rescue, glucarpidase (Garboxypeptidase G2), was then given to patient to rapidly lower serum methotrexate level. Glucarpidase cleaves methotrexate molecule to inactive metabolite, DAMPA (2,4-diamino-N-methylpteroic acid). After glucarpidase rescue, patient’s methotrexate level were still remained above the toxic level on the following two days (1.02 μmol/L and 0.68 μmol/L).

In most clinical laboratories, serum methotrexate is measured by immunoassays, and the inactive metabolite of methotrexate after glucarpidase rescue, DAMPA, cross-reacts with immunoassays and interferes the measurement of methotrexate. After glucarpidase treatment, patient’s methotrexate level can be falsely high for 5-7 days, before accurate measurement can be obtained using immunoassays. In this case, the concentrations of methotrexate after glucarpidase rescue were falsely high results due to DAMPA interference. There are laboratory-developed LC-MS methods to detect methotrexate. LC-MS methods are more specific and have no interference from the metabolite, can be used for accurate methotrexate measurement in the case of glucarpidase rescue.


Xin-small

-Xin Yi, PhD, DABCC, FACB, is a board-certified clinical chemist, currently serving as the Co-director of Clinical Chemistry at Houston Methodist Hospital in Houston, TX and an Assistant Professor of Clinical Pathology and Laboratory Medicine at Weill Cornell Medical College.

Jaffe vs. Enzymatic Method for Serum Creatinine Measurement

The Jaffe and enzymatic methods are the two most common methods for measuring serum creatinine. The Jaffe method is less expensive than the enzymatic assay ($0.30 vs $2.00 per test based on 2014 list prices) but is more susceptible to interferences. Although these tests are not expensive, they are high-volume tests and the savings could be substantial. We were using the enzymatic assay at the University of Utah and estimated that we could save about $50,000 per year by switching to the Jaffe assay; however, we were uncertain whether the Jaffe assay was safe to use due to the potential for interferences. For that reason, we decided to conduct a risk assessment to evaluate the suitability of the Jaffe assay.

Risk is defined as the expected cost of an action. The expected cost has two components: 1) the probability that an event will occur and 2) the consequences or cost of an event:

Risk = prob(event) x cost(event)

The event of interest was misclassification of a patient due to an error in serum creatinine measurement. Nephrologists classify kidney disease based on the estimated glomerular filtration rate which is based on the creatinine value. The distribution of eGFR for patients at our hospital is shown in Figure 1. The dashed lines show decision limits that nephrologists use to classify kidney disease. An eGFR is considered normal or healthy.

We spoke with the nephrologists and learned that they were relatively unconcerned about errors in eGFR in healthy patients (eGFR above 60 ml/min) because there was no potential for harm. Similarly, they felt there was relatively little risk of harm to patients with low eGFRs because these patients are routinely monitored and no major decision would be based solely on a single eGFR measurement. An error in creatinine measurement in a low eGFR patient would be detected by repeat measurements or be inconsistent with other measurements. From the nephrologists’ point of view, the only area of concern was in the region around 60 ml/min.  Patients about 60 ml/min are considered healthy whereas those below 60 ml/min are diagnosed with stage 3a chronic kidney disease. In this zone, an error in serum creatinine could result in a false negative (i.e. observed eGFR greater than 60 ml/min when the true eGFR was less than 60 ml/min). In such cases, a patient may go without care and their disease could progress.  The nephrologists believed that the potential for harm was relatively minor, but potential for harm did exist.

We compared the eGFRs provided by the enzymatic and Jaffee methods to estimate how often patients might be misclassified (Figure 2).1 Focusing on the 60 ml/min decision limit, we found that 17 of 500 (3.4%) of measurements were discordant. Some of these discordant results would be due to imprecision. Discordance due to imprecision would have small differences (bottom of Figure 2) and are unavoidable – they would occur using any method. Discordance due to interference would be expected to have larger differences (top of Figure 2) and could be avoided by using the enzymatic method. We used statistical techniques to estimate the proportion of discordances that were due to interference vs imprecision and found that about 60% of the discordance at the 60 ml/min limit was due to interference. In summary, our risk analysis showed that using the Jaffe method would pose about a 2% rate of avoidable misclassification which presented some potential risk to patients. The nephrologists felt the risk was low but, in theory, disease could unnecessarily progress in a patient with a false negative diagnosis.

Our risk analysis was based on analytical error. We compared magnitude of analytical error to the biological variation in eGFR and found that the analytical error was relatively small in comparison to biological variation (data not shown).  Biological variation was likely to be a more significant cause of misclassification than analytical error.

So, what to do? Was the potential savings of the Jaffe method worth the risk? Some experts recommend against using the Jaffe method. 2-4 On the other hand, most US laboratories use the Jaffe assay. A recent College of American Pathologists proficiency challenge found that 70% of the submitted results were based on the creatinine assay.5

We decided to get the best of both worlds by using BOTH methods. We defined a zone of risk surrounding the 60 ml/min eGFR decision limit (Figure 3). Results in this zone would have some risk of misclassification whereas results outside of the zone would be unlikely to be misclassified using the Jaffee method. All creatinine measurements are initially performed using the Jaffe method. If the result is outside the risk zone, the result is reported. If results fell within the risk zone, they were repeated with the enzymatic method and the results of the enzymatic method are reported. This reflex procedure saves money while avoiding risk. The reflex rate is approximately 15%.

There are circumstances in which one would want to order the best possible test. To that end, we created a special orderable test, based on the enzymatic method, that the nephrologists could use to insure the most accurate results when required. For example, the enzymatic test may be indicated when making decisions regarding biopsies for renal transplant patients. The order volume for the special test has been less than 100 orders per year. 

creat1
Figure 1. Distribution of Estimated Glomerular Filtration rates (eGFR). The distribution is for outpatients at University of Utah for calendar year 2014. The dashed lines indicate decision limits used for classification of chronic kidney disease (15, 30, 45 and 60 ml/min). eGFRs greater than 60 ml/min are considered disease free.
creat2
Figure 2. Discordances in estimated glomerular filtration rate (eGFR) at the 60 ml/min decision limit. The length of each arrow, represents the difference between estimates based on the Jaffe (head) and enzymatic (tail) methods. The dashed line represents two standard deviations of expected imprecision of the difference. Differences greater than 2 standard deviations would most likely be due to analytical interference (loss of specificity).
creat3
Figure 3. Reflex test strategy. The figure shows the distribution of eGFR values for outpatients at the University of Utah.  The dashed lines represent clinical decision limits. The yellow zone represents the range of eGFR values where misclassification could pose a risk to patients. Creatinine is first measured by the Jaffe method. The Jaffe result is reported if the estimated eGFR is outside the yellow zone. If the eGFR is within the yellow zone, the measurement is repeated using the enzymatic method and the result based on the enzymatic method is reported.

References

  1. Schmidt RL, Straseski JA, Raphael KL, Adams AH, Lehman CM. A Risk Assessment of the Jaffe vs Enzymatic Method for Creatinine Measurement in an Outpatient Population. PloS one. 2015;10(11):e0143205.
  2. Cobbaert CM, Baadenhuijsen H, Weykamp CW. Prime time for enzymatic creatinine methods in pediatrics. Clinical Chemistry. 2009;55(3):549-558.
  3. Drion I, Cobbaert C, Groenier KH, et al. Clinical evaluation of analytical variations in serum creatinine measurements: Why laboratories should abandon Jaffe techniques. BMC Nephrology. 2012;13(1).
  4. Panteghini M. Enzymatic assays for creatinine: time for action. Scand J Clin Lab Invest Suppl. 2008;241:84-88.
  5. College of American Pathologists. Chemistry/Therapeutic Monitoring, Participant Survey. 2014.


Schmidt-small

-Robert Schmidt, MD, PhD, MBA, MS is currently an Associate Professor at the University of Utah where he is Medical Director of the clinical laboratory at the Huntsman Cancer Institute and Director of the Center for Effective Medical Testing at ARUP Laboratories.

Chemistry Case Study: Protein Bands in All Lanes of the Immunofixation Electrophoresis

Waldenstrom Macroglobulinemia (WM) is defined as lymphoplasmacytic lymphoma (LPL) with IgM paraprotein and bone marrow involvement. The IgM paraprotein is an important serum marker for WM diagnosis, symptom prediction, disease burden assessment, treatment decision and drug response evaluation. Serum protein electrophoresis (SPEP) in conjunction with immunofixation electrophoresis (IFE) are the routine laboratory tests for IgM paraprotein detection, quantitation and characterization. A monoclonal protein typically presents as a sharp band on SPEP and selective lanes of IFE, allowing characterization of the immunoglobulin heavy chain isotypes and light chain classes. In rare situations, a monoclonal band is seen on all immunofixation lanes, suggesting cryoglobulin and/or soluble immune complex. We encountered a recent case of WM with a strong demarcated band on all immunofixation lanes.

The patient is a 76-year-old Chinese man diagnosed as WM/LPL by bone marrow biopsy. Peripheral blood showed pancytopenia with rouleaux formation. The serum IgM was up to 6900 mg/dL. Serum viscosity was increased up to 3.1 cP (normal range 1.5-1.9 cP). Serum rheumatoid factor was negative (<10 IU/ml). Serum protein electrophoresis (SPEP) on Sebia Hydrasys 2 showed a wide smearing pattern (Fig 1A). Serum protein immunofixation electrophoresis (IFE) showed a monoclonal band on all lanes with equal intensity, preventing isotype identification (Fig 1B). This pattern is generally believed to be due to cryoglobulin and/or polymerization of monoclonal proteins, similar to rheumatoid factor activity. Urine electrophoresis was consistent with an overflow pattern and urine immunofixation showed monoclonal free lambda light chain.

Previously it was demonstrated that cryogolublin dissolution was achieved by pre-treatment of serum samples with Fluidil. The IgM polymer can be disrupted by adding reducing agents such as beta-mercaptoethanol (bME) to disrupt the disulfide bonds (1-2). In our case, despite pretreatment with Fluidil and bME, no isotype resolution was achieved on serum IFE, prompting us to develop a novel method through the addition of sodium dodecyl sulfate (SDS) to the pretreatment process. Different combinations of reaction conditions were tested, including SDS concentration ranging from 0.01 to 1%, three different temperatures (37, 56 and 95 °C), three different concentrations of bME (1%, 2% and 4%) and three different serum volume (25 µL, 50 µL and 75 µL). Optimal isotype resolution was achieved using 0.1% SDS/0.25%bME/Fluidil incubated at 56°C for 30 mins (Fig 1C).

WMimg1


References

  1. Attaelmannan M, Levinson SS. Understanding and identifying monoclonal gammopathies. Clin Chem. 2000 Aug; 46(8 Pt 2):1230-8.
  2. Yusra Othman. Protein Bands in All Lanes of the Immunofixation Electrophoresis Pattern of Serum From a 50-Year-Old Saudi Woman. Lab Med (2006) 37 (3): 152-154.


HL

-Huifei Liu, MD, PhD. Former PGY4 resident in the Department of Pathology and Genomic Medicine, Houston Methodist Hospital. She currently serves as the associate medical director at Hematologics, Inc., Seattle, WA.  

Xin-small

-Xin Yi, PhD, DABCC, FACB, is a board-certified clinical chemist, currently serving as the Co-director of Clinical Chemistry at Houston Methodist Hospital in Houston, TX and an Assistant Professor of Clinical Pathology and Laboratory Medicine at Weill Cornell Medical College.

Pathologist On Call: Fluctuating Parathyroid Hormone with Normal Calcium in an Elderly Man

Case:

A 75 year old Alzheimer’s dementia patient.  Parathyroid hormone (PTH) levels were ordered.

Analyte

(Reference

Range)

05/13 10/13 12/13 7/14 10/14 04/15 09/15 03/16 07/16
PTH

(10-65 pg/mL)

869 42 864 47 1180 48
Ca2+

(8.8-10.2 mg/mL)

10.3 10.5 10 10 9.6 10
Vit D

(2-100 ng/mL)

26 21 39 49 39 57 19


Why order PTH? 

PTH is ordered to assess for hyperparathyroidism.  There are two forms of hyperparathyroidism: primary and secondary.  Primary hyperparathyroidism can be caused by a parathyroid (PT) adenoma,  PT hyperplasia, or a non-PT malignancy such as squamous cell cancer or multiple myeloma.  Secondary hyperparathyroidism occurs in response to hypocalcemia which can arise from insufficient intake of vitamin D or chronic renal failure (which results in insufficient vitamin D).   There is weak evidence suggesting a positive correlation between PTH and cognitive decline.(1, 2)  Progression of cognitive decline is slowed when PTH and vit D levels are normalized.

Action of PTH: PTH is a peptide hormone that controls calcium levels in the blood. It is secreted as a prohormone and is cleaved in the blood.  The 34 residue N-terminal fragment is active and has a half-life of about 5 minutes.  The C-terminal end has a half-life or 2 hours and is diagnostically insignificant because it is physiologically inactive.  PTH activates receptors on osteoclasts which causes them to release bone calcium.  PTH also increases renal synthesis of 1,25 OH2 vitamin D which, in turn, increases intestinal absorption of calcium.

What would make the PTH level fluctuate so much?

This is most likely a case of incipient normocalcemic primary hyperparathyroidism (NPH).(3-5)  PTH levels are higher than normal but calcium levels are normal.  PTH levels tend to fluctuate. Calcium can also be sometimes elevated as well.   The disease is thought to be a mild or early form of hyperparathyroidism and 20 percent of patients go on to develop worsening hyperparathyroidism. How should NPH be managed?  Parathyroidectomy or monitoring are the primary alternatives; however, the best way to manage this disease is unknown.


References

  1. Lourida I, Thompson-Coon J, Dickens CM, et al. Parathyroid hormone, cognitive function and dementia: A systematic review. PLoS ONE 2015;10.
  1. Björkman MP, Sorva AJ, Tilvis RS. Does elevated parathyroid hormone concentration predict cognitive decline in older people? Aging Clinical and Experimental Research 2010;22:164-9.
  1. Shlapack MA, Rizvi AA. Normocalcemic primary hyperparathyroidism-characteristics and clinical significance of an emerging entity. Am J Med Sci 2012;343:163-6.
  1. Lowe H, McMahon DJ, Rubin MR, Bilezikian JP, Silverberg SJ. Normocalcemic primary hyperparathyroidism: Further characterization of a new clinical phenotype. Journal of Clinical Endocrinology and Metabolism 2007;92:3001-5.
  1. Crowley RK, Gittoes NJ. Elevated PTH with normal serum calcium level: A structured approach. Clinical Endocrinology 2016;84:809-13.


Schmidt-small

-Robert Schmidt, MD, PhD, MBA, MS is currently an Associate Professor at the University of Utah where he is Medical Director of the clinical laboratory at the Huntsman Cancer Institute and Director of the Center for Effective Medical Testing at ARUP Laboratories.