Hello again!
I hope everyone is staying safe and healthy during these unfortunate times. My last post was in relation to being a new MLS grad and beginning my career as a molecular technologist at Northwestern University’s Transplant Lab. Time definitely flies by!
Today I’m going to provide a basic introduction on an assay I’ve recently been trained on called Short Tandem Repeat (STR). If you were to take a glance at your genome, it would be littered with many repeating sequences. While there are many different classifications of repeating sequences, STRs are a type of tandem repeating sequence where each repeat is approximately 2 to 7 nucleotides in length.1,2,3 STR is well-known in forensic science to help identify a suspect at a crime scene when different sources of DNA are present. Yet, its applications are many – from cell line confirmation, paternal testing, and all the way to chimerism analysis!4
STRs are polymorphic, one useful characteristic among many, which make its utilization in identifying the source of DNA particularly advantageous. An STR allele is defined by the number of times the repeating sequence, defined above, repeats. (Image 1).1 Individuals are either heterozygous or homozygous at each locus. As the number of STR loci being evaluated increases, the statistical power of discrimination increases and the likelihood of another individual having the same profile becomes increasingly unlikely and detecting small differences increases.3,4 In our lab, we evaluate a total of 21 different loci!
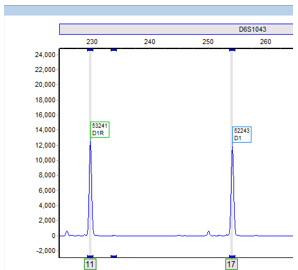
Additionally, in our HLA lab we utilize STR to monitor chimerism status in patients who have undergone an allogeneic stem cell transplant. Before their transplant, patients are matched to a donor through their HLA system (different from STR). Once an HLA match is confirmed, we utilize the patient’s pre-transplant and the donor’s sample to generate STR informative alleles. Informative alleles are alleles that are present only in the recipient and not the donor. These alleles are important because stem cell transplants replace the recipient’s marrow and the detection of recipient DNA in post-transplant samples is crucial to identifying rejection or relapse of their disease. Additionally, loci that contain informative alleles are defined as informative loci, these are the loci then used to identify the percentage chimerism (Image 2).
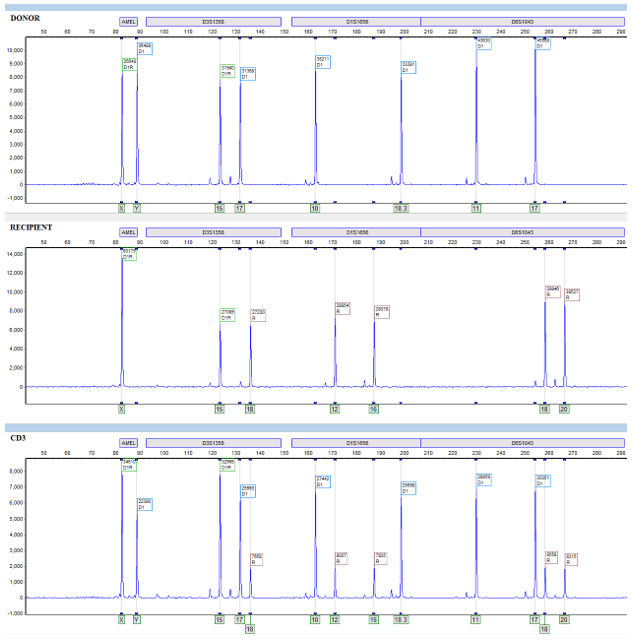
When recipient cells begin to re-emerge, we can detect the relative allele peaks and assign them to the recipient or donor by referring to the informative alleles. Allele peaks are then utilized through equations in our software that measure the area under these defined peaks and then compute a donor percentage chimerism. Once that informative report is created, we can compare any proceeding post-transplant sample to determine the patient’s chimerism status (Image 2).
Interesting enough, we don’t simply isolate the DNA from the post-sample buffy like we would with other samples. Rather, we separate each post sample into a total of three sub-samples. The first is simply the patient’s peripheral blood – nothing fancy. The other two are isolated from the rest of the peripheral blood that was not used into two separate cell lineages – lymphocytes (CD3+) and myelocytes (CD33+). This process is extremely labor-intensive, being able to process a set of up to 8-12 patients at a time and each set taking up to 4-5 hours.
The process begins by aliquoting peripheral blood for DNA isolation (sample 1) and taking the remainder and layering it over a lymphocyte separation medium (LSM). Then harvesting the lymphocyte/white cell layer from the spun down LSM. We then go on to add CD3 and CD33 antibody selection cocktails and magnetic beads. Then, we do a series of washes with magnets and eventually end up with our purified CD3 and CD33 cell populations. Their purity is determined through flow cytometry, an important component to confirm that our leukocyte subsets aren’t contaminated with other leukocyte populations – as contamination would defeat the purpose of analyzing different lineages.
Finally, we take the isolated DNA from the three sub-samples and amplify it with specific primers and fluorescent tags through PCR. Then the samples are loaded onto a capillary electrophoresis instrument. This instrument will detect each fragment length, defined by the primers and the repeats within, and be able to identify these fragments through size, fluorescent tags, lasers, and detectors. The instrument will then generate data that we can take to our analyzing platform, which is ChimerMarker. Through this we can analyze the data and generate our clinical reports.
Though extremely time intensive, lineage-specific chimerism is critical in stem cell transplant because it is more informative and sensitive than total leukocyte analysis – being several magnitudes more sensitive than analyzing just peripheral blood alone. It permits early detection of small chimeric cell populations that otherwise may go undetected, as one subset in the peripheral blood may “mask” another subset that has increasing percent recipient cells. Diagnosing these small cell chimeric cell populations as early as possible is critical for therapeutic interventions and reductions in graft rejections.2,5,6
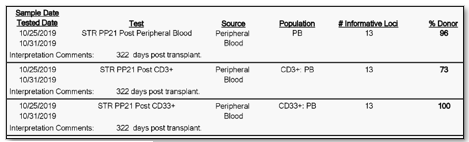
Furthermore, not only is their detection important, but through our analysis we can calculate the percentage of donor cells and recipient cells. We oftentimes report out the donor percentage (%) chimerism. For example, a patient at 322 days post-transplant could have a donor chimerism of 96% in their peripheral blood, 100% in their CD33 lineage, and 73% in their CD3 lineage. Then, at day 364 post-transplant they may then be at 100% in their peripheral blood, 100% in their CD33 lineage, and 92 percent in their CD3 lineage. Two things to notice in this example is that the percentages are changing (increasing in donor chimerism in this case) and that the peripheral blood expressed 100% chimerism in the second sample at 364 days, but when we look specifically at the CD3 sub-population at 364 days there was still 8% of recipient cells present (Image 3 & 4).

Some studies have focused not only on the trends in percentages changing, but also in their relative percentage constellation. For example, one study found that increased recipient CD3 cells had an increased predictive factor of graft rejection. It was also found that further sub-leukocyte populations increased this predictive power.5 Even more, there have been some studies that have looked at chimerism and its usefulness in predicting graft versus host disease (GvHD). This disease is defined by donor leukocytes attacking the leukocytes and tissues of the recipient. Through these and other findings, the potential and applicability of chimerism monitoring is extremely crucial to patient care during their transplant progression.2,5,6,7
While engraftment is a very dynamic process, varying from individuals and disease-types, engraftment monitoring is one way to monitor and ultimately influence therapeutic approaches.2,5,6 I am proud to be able to contribute to the wonderful team here at Northwestern University and I strive to learn more about the process – both clinical and in the lab. In future articles, I hope to go into more detail about the process and other assays that we perform.
Thanks for reading! Until next time! Stay well and safe during these uncertain times!
References
- Life Technologies. 2014. DNA Fragment Analysis by Capillary Electrophoresis. Thermo Fisher Scientific. http://www.thermofisher.com/content/dam/LifeTech/global/Forms/PDF/fragment-analysis-chemistry-guide.pdf.
- Kristt, D., Stein, J., Yaniv, I., & Klein, T. (2007). Assessing quantitative chimerism longitudinally: technical considerations, clinical applications and routine feasibility. Bone Marrow Transplantation, 39(5), 255–268. doi: 10.1038/sj.bmt.1705576
- Clark, J.R., Scott, S.D., Jack, A.L., Lee, H., Mason, J., Carter, G.I., Pearce, L., Jackson, T., Clouston, H., Sproul, A., Keen, L., Molloy, K., Folarin, N., Whitby, L., Snowden, J.A., Reilly, J.T. and Barnett, D. (2015), Monitoring of chimerism following allogeneic haematopoietic stem cell transplantation (HSCT): Technical recommendations for the use of Short Tandem Repeat (STR) based techniques, on behalf of the United Kingdom National External Quality Assessment Service for Leucocyte Immunophenotyping Chimerism Working Group. Br J Haematol, 168: 26-37. doi:10.1111/bjh.13073
- Short Tandem Repeat Analysis in the Research Laboratory. (2012). Retrieved April 10, 2020, from https://www.promega.com/resources/pubhub/short-tandem-repeat-analysis-in-the-research-laboratory/
- Breuer, S., Preuner, S., Fritsch, G., Daxberger, H., Koenig, M., Poetschger, U., … Matthes-Martin, S. (2011). Early recipient chimerism testing in the T- and NK-cell lineages for risk assessment of graft rejection in pediatric patients undergoing allogeneic stem cell transplantation. Leukemia, 26(3), 509–519. doi: 10.1038/leu.2011.244
- Buckingham, L. (2012). Molecular diagnostics: fundamentals, methods, and clinical applications. Philadelphia: F.A. Davis Company.
- Rupa-Matysek, J., Lewandowski, K., Nowak, W., Sawiński, K., Gil, L., & Komarnicki, M. (2011). Correlation Between the Kinetics of CD3 Chimerism and the Incidence of Graft-Versus-Host Disease in Patients Undergoing Allogeneic Hematopoietic Stem Cell Transplantation. Transplantation Proceedings, 43(5), 1915–1923. doi: 10.1016/j.transproceed.2011.02.011
-Ben Dahlstrom is a recent graduate of the NorthShore University HealthSystem MLS program. He currently works as a molecular technologist for Northwestern University in their transplant lab, performing HLA typing on bone marrow and solid organ transplants. His interests include microbiology, molecular, immunology, and blood bank.
