Here comes the fun part. It’s taken a day for library prep, an overnight run for the clonal amplification; the next day includes loading the chip with the ISPs and then running the chip on the sequencer. After the chip has run on the sequencer, the data is pushed from the sequencer (the PGM) to the server connected to the sequencer. This aspect of NGS surprised me – the size of the files is amazing – for one 316 chip, the file that includes all of the raw data averages about 100GB. To deal with this amount of data, the server attached to the sequencer is 12TB, and even still we have to have a procedure to deal with removing files off that sequencer to keep space for future runs.
Anyway, the raw data is pushed to the server and the data analysis begins. The Torrent Suite Software first analyzes the ISP info, as shown in the graphic below. It gives a “heat map” of the chip (the football shape) in which red means the wells in those areas were full with ISPs. Yellow means there are fewer ISPs and blue means there are none. So, you can see below, there is a small area of blue within the football shape – this area did not have any ISPs in it. 92% of the wells on this chip were filled, however, which is about the max a chip can be loaded.

These ISPs are then broken down into categories. First, how many of the wells had ISPs in them – here, 92.5% of the 6,337,389 wells contained ISPs. Of those ISPs, 99.8% of them have product on them that can be sequenced (Live ISPs). Of those Live ISPs, 0.4% of them contain control Test Fragments and 99.6% of them contain actual patient sample library amplicons. The Test Fragments are spiked in prior to sequencing and act as a control to evaluate how the sequencing run performed. Lastly, the ISPs that contain patient sample library amplicons are analyzed. Those ISPs that contain more than one amplicon (say it has an amplicon of EGFR Exon 19 and another specimen’s amplicon of KRAS Exon 2) give mixed signals and cannot be analyzed, so they are thrown out of the data analysis and into a bin called “polyclonal”. Low quality ISPs are also thrown out – anything that did not pass the thresholds for quality. And lastly, ISPs that only contain adapter dimers are thrown out. For a run of AmpliSeq Cancer Hotspot Panel v2 specimens, most of which come from FFPE specimens that are low quality to start with, a run that contains over 50% Final Library ISPs is actually a very good run, interestingly enough. The 316v2 chips are rated to sequence 1 million reads (each ISP yields one read), and on this example run, over 3 million reads were sequenced, so this is a successful run.
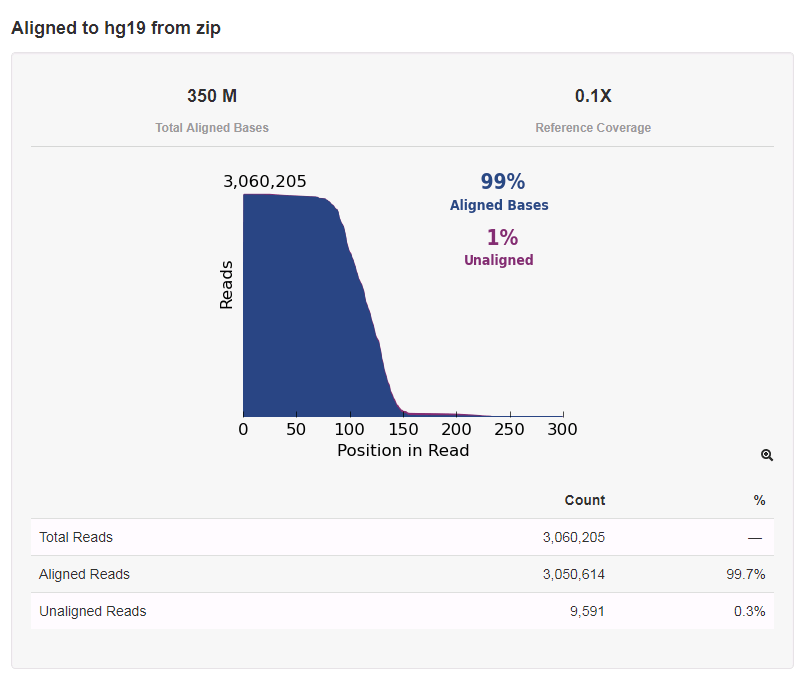
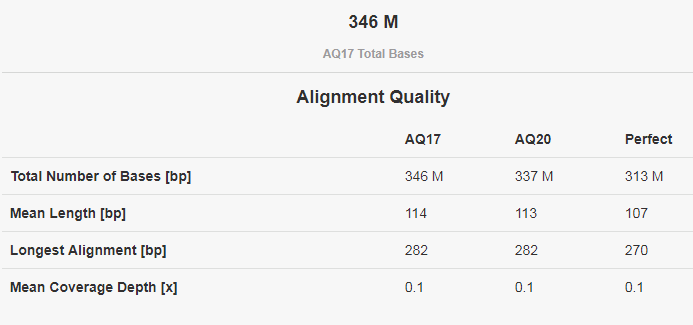
After the ISPs are analyzed and the high quality ones are kept, the analysis goes on. The Torrent Suite software then calls the bases based on the raw flow data. These bases are then aligned to a reference, in our case hg19, a commonly used human genome reference. Quality scores are assigned at this point. A Phred-based quality score is used for NGS, shown in the table below.

Lastly, the reads are put into bins based on the barcode that was used for each patient specimen – remember the small part of the adapter that was added in library prep so that the specimens could be mixed together? The software reads that adapter sequence then assigns each read based on those sequences. The specimens should all have approximately the same number of reads since they were normalized to the same concentration at the end of library prep, but there may be some variability due to specimen quality, as you can see below.

In next quarter’s post, we will dive into the individual specimen results!

-Sharleen Rapp, BS, MB (ASCP)CM is a Molecular Diagnostics Coordinator in the Molecular Diagnostics Laboratory at Nebraska Medicine.

That has the be the Reddest chip I’ve ever seen! Well done. To everyone else- don’t despair if your results aren’t quite this good, I’m sure you can still get the information you’re looking for.
what are duplicate reads? How important is that for the analysis in ion torrent?
Duplicate reads indicate a unique strand of DNA is cloned multiple times in the PCR reaction, so expansion of a single stand (duplication) can bias the frequency of a variant. This is hard to identify in amplicon based platforms like ion Torrent and is most applicable to fragmentation/ hybridization based approaches like for Illumina platforms.
Do we need any reference to detect? consider we use a cfdna breast cancer panel, do we need to create a standard reference from to compare and distinct those who have cancer and those who do not?